According to a recent Santiment insights article, XRP is one of the better-looking NVT charts in the entire crypto market, considering the increase in network circulation in May, with a further correction in June.
XRP Has One of Best Looking Charts in Crypto, Here’s Why
Even more, the NVT chart may form a divergence for XRP, which would be a bullish factor for XRP by the end of this summer. The NVT is a digital assets industry alternative to the PE ratio, which evaluates asset value by market capitalization divided by transaction volume. If the value is too high, the network is considered overvalued compared to the low transaction volume.
To simplify: whenever NVT values are high, the asset is considered bearish, as the worth of the network is overvalued and a coin or token is considered bullish if the market cap is undervalued compared to the high transaction volume. XRP’s case As the NVT suggests, XRP is currently bullish, as the price of the asset took a huge hit, dropping to multi-week lows at $0.33, which makes the market capitalization of the asset significantly lower despite the remaining transactional activity.
Circulation suddenly picked up a lot of steam on the network in May, and like most assets, it was still pulled down a bit further in June. But August appears as though it’s on its way to revealing a bullish or semi-bullish NVT divergence for XRP by the end of the month. And with four straight months in the green, this could be promising.
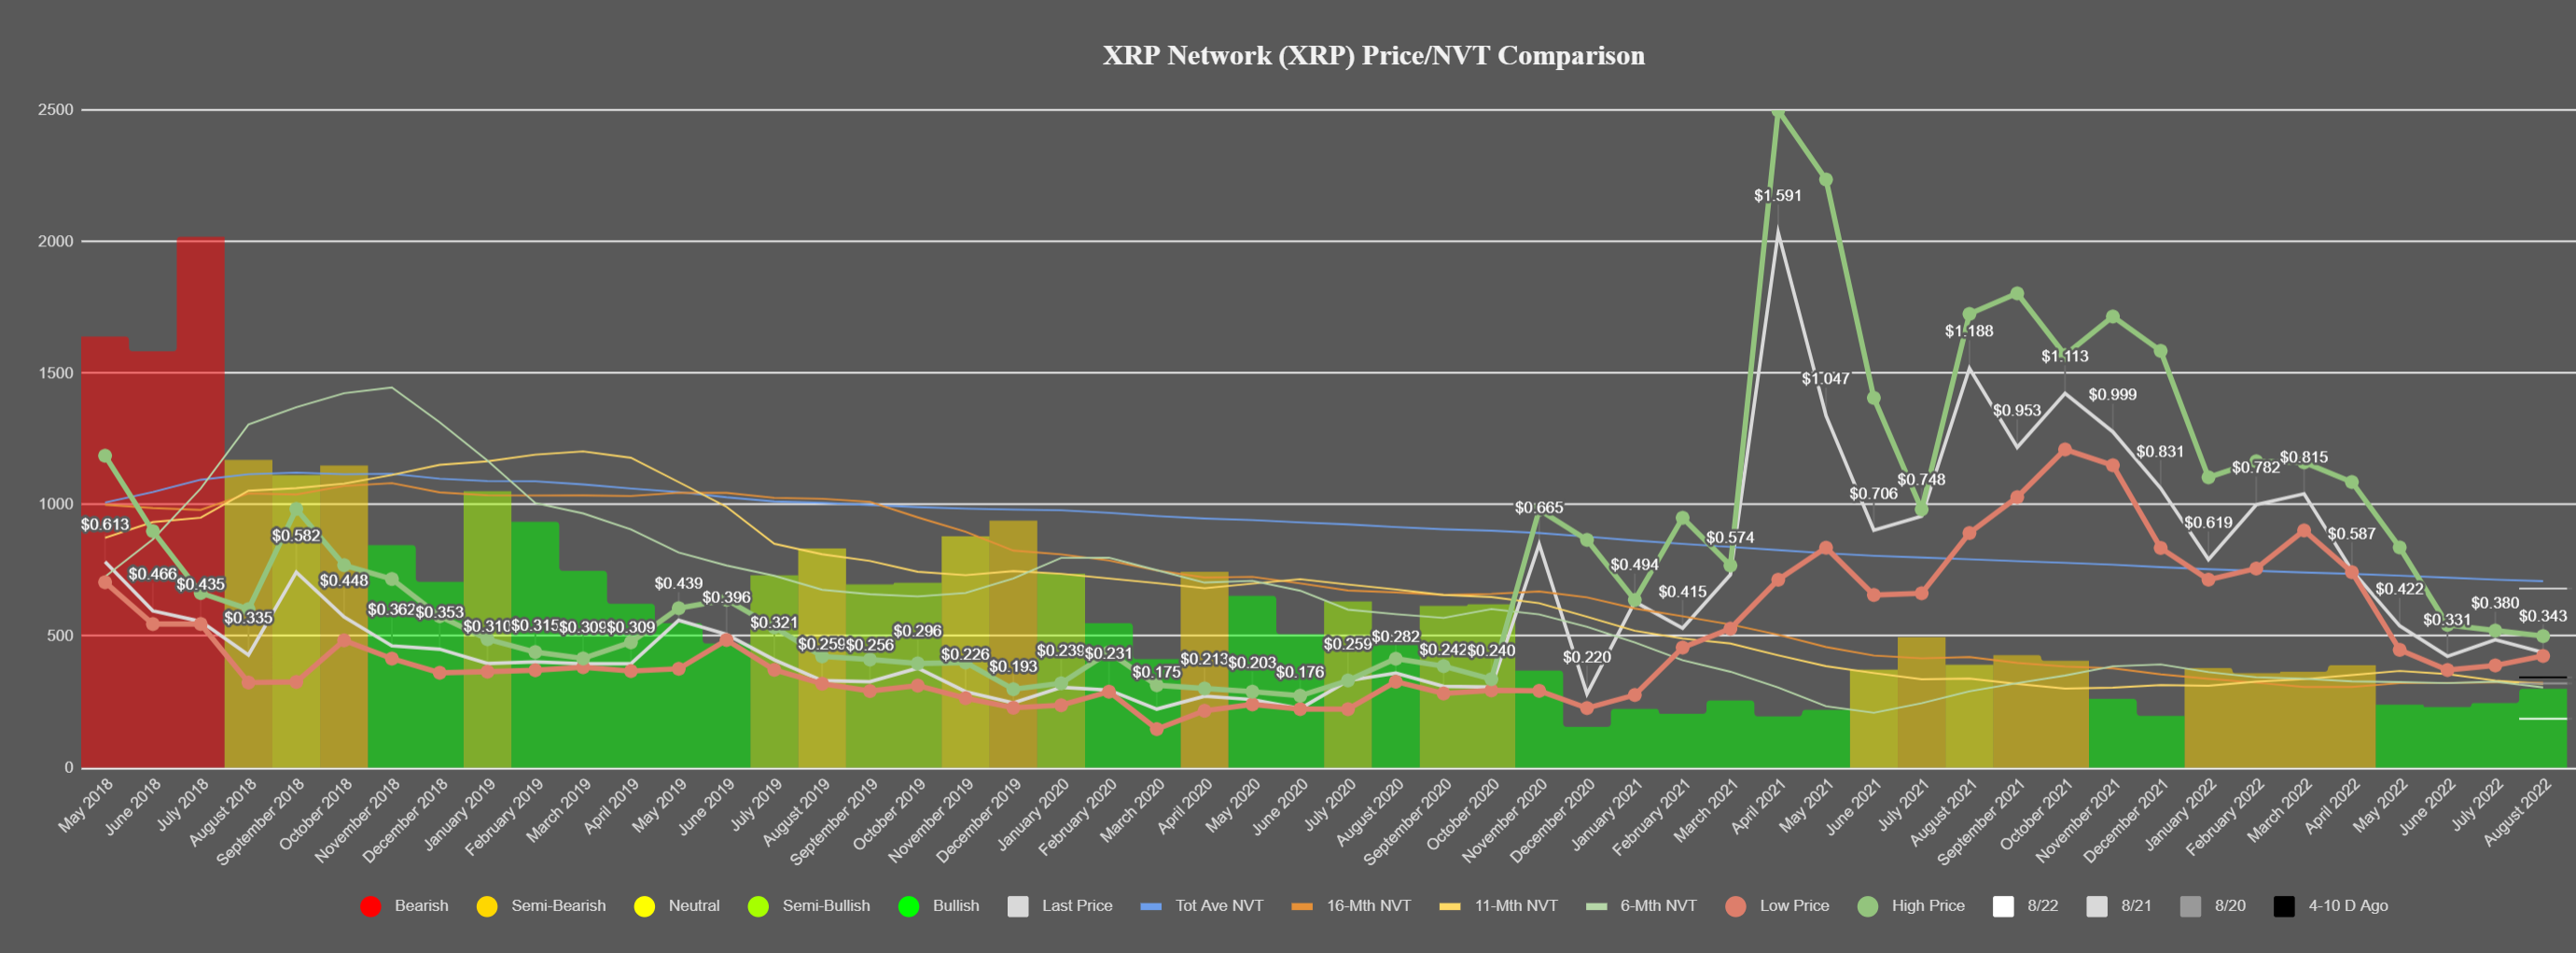
Source: Santiment Insights
With the high activity of XRP users and a low market capitalization, a divergence occurs that hints at a possible reversal that might happen once the correction on the market is over. NVT is one of many indicators that were hinting at the retrace of XRP as the Relative Strength Index shows that the asset is oversold on certain timeframes. This suggests the imminent fading of the bearish rally.

XRP/USD 4-hour chart | Source: TradingView
At press time, XRP is changing hands at $0.34 and losing 1.4% of its value in the last 24 hours.
Read more:
- Ripple Has Again Sold Large Amount Of XRP As It Joined Exchanges In Wiring Nearly 320 Million XRP
- XRP And ADA Are Among Few Who Finished Last Week With Positive Values Of Fund Flows