Veteran trader Peter Brandt saw a volatile move incoming on Shiba Inu as he posted SHIB forming a bottom pattern on the daily chart on TradingView the day before the massive 25% move. At press time, Shiba Inu is changing hands at $0.00001555 and is losing around 8% of its value in the last 24 hours.

SHIB/USD 4-hour chart | Source: TradingView
The veteran trader believes that Shiba Inu (SHIB) has entered a bull market
Recently, Brandt shared another trading idea, suggesting that Shiba Inu entered a bullish cycle and was going to move further up. The reason for such a bold prediction is the successful completion of the inverted H&S pattern, which is a direct signal for a reversal.
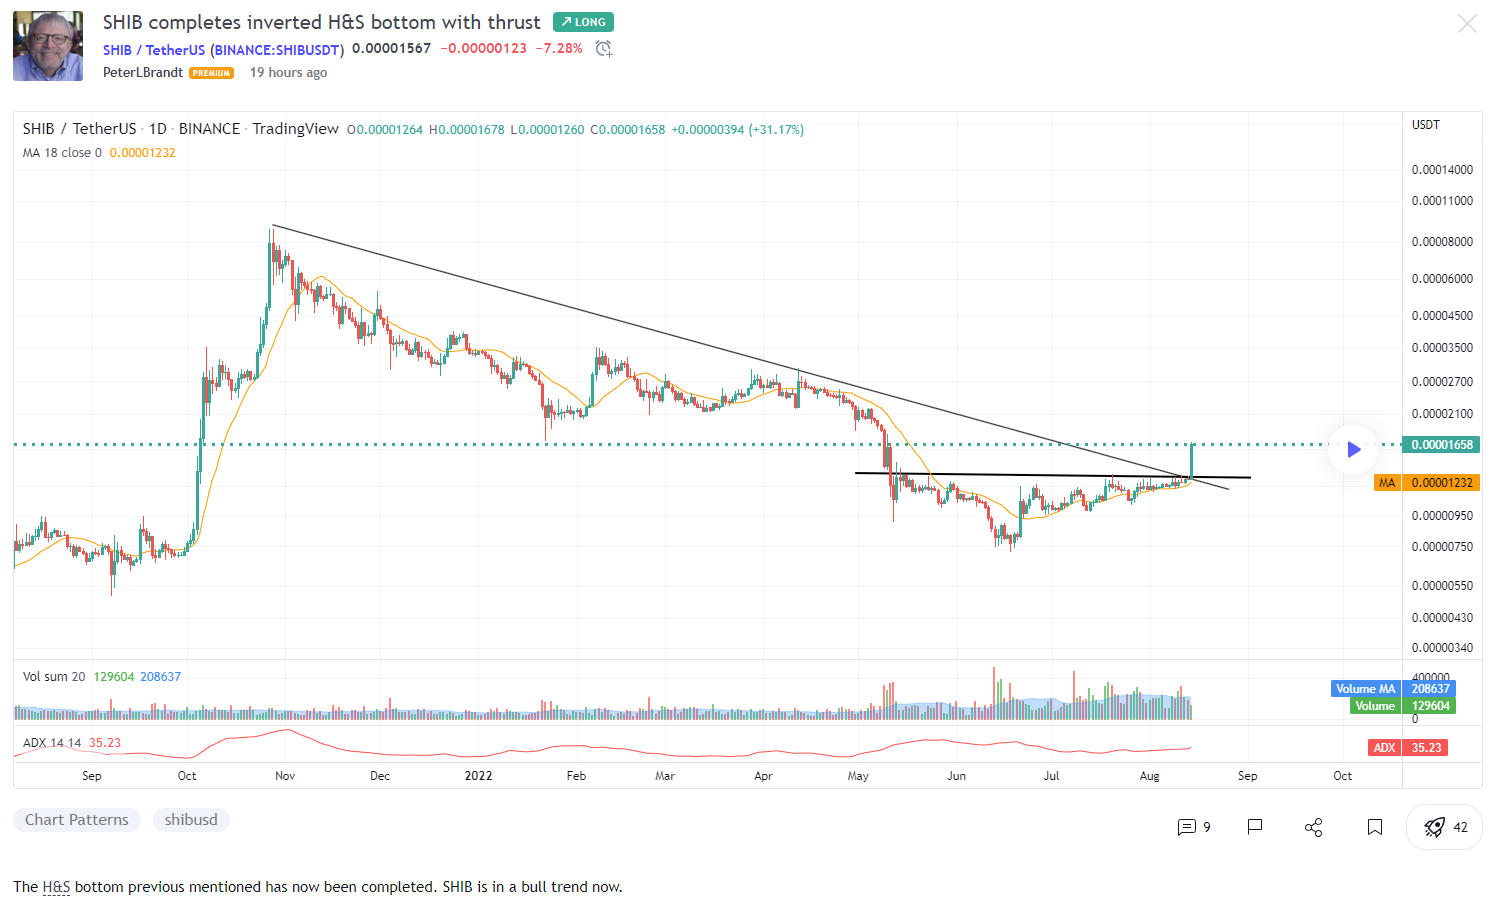
Another factor that speaks in favor of the upcoming bull market for Shiba Inu is the 25% thrust, which reflects the bullishness of investors who are ready to support the rally of the token in case of a successful further breakout. Technically, Brandt’s analysis suggests that Shiba Inu bottomed out and now has no other path but up. Is it as good as the savvy trader suggests?
From a technical standpoint, Brandt’s analysis is more than accurate as Shiba Inu has been showing numerous signs of reaching a local bottom after the assets entered a prolonged consolidation cycle that lasted more than 90 days. In addition to a strong technical position in the market, the Shiba Inu ecosystem grew fundamentally, adding more decentralized solutions to the network, creating use cases, and growing as a project. A direct sign of growth is the holders’ composition which changed from the purely speculative dominance of short-term holders to a fundamentally strong composition of investors holding the token for around a year.
Read more:
- After A Faltering First Half Of 2022, Shiba Inu (SHIB) Showed Signs Of Recovery That Began In July
- After Shiba Inu And Dogecoin, Gucci Has Now Started Accepting ApeCoin