Last week started with some relatively low-volatility range-bound trading before a massive spike on Friday reminiscent of the week before appeared and pushed us into the $22K level for BTC and $1650 level ETH. This upcoming Friday will see a significant amount of options expiring prior to the FOMC event totaling around $1.31B notional for BTC and $763M in ETH.
Dealers have been net a significant amount of short gamma as upside call buying came in size last week flooding across the $22-24K strike range. As previously discussed, this dealer short gamma can cause an increase in market volatility and drive large moves quite quickly – especially as those who have open short positions with leverage quickly have to cover losses or risk being liquidated.
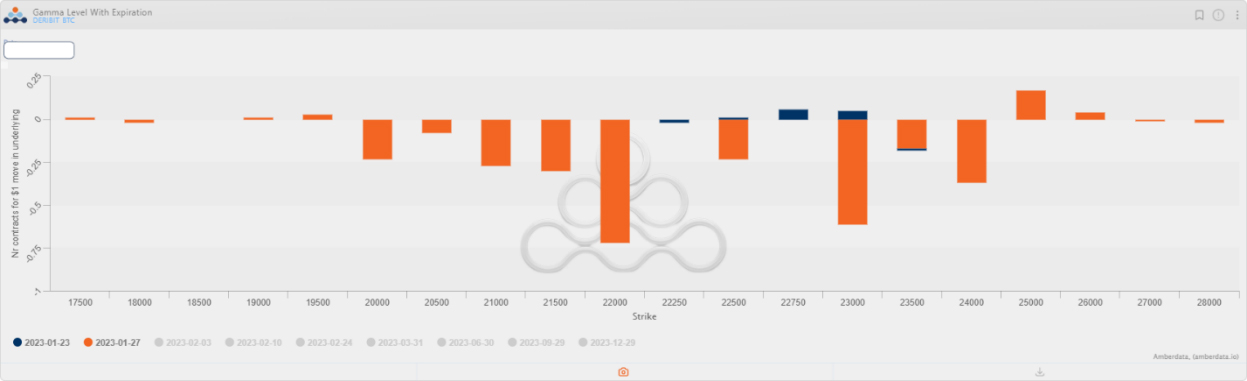
Figure 1.Dealer Gamma Exposure by Expiry: BTC
ATM vs. RV for BTC and ETH
RV vs ATM IV for BTC saw most of the week with IV trading below realized before finishing the night off with ATM IV back to trading at a slight premium. The volatility risk premium for BTC is currently around 6 IVs as BTC currently realizes around 53.5 vols.
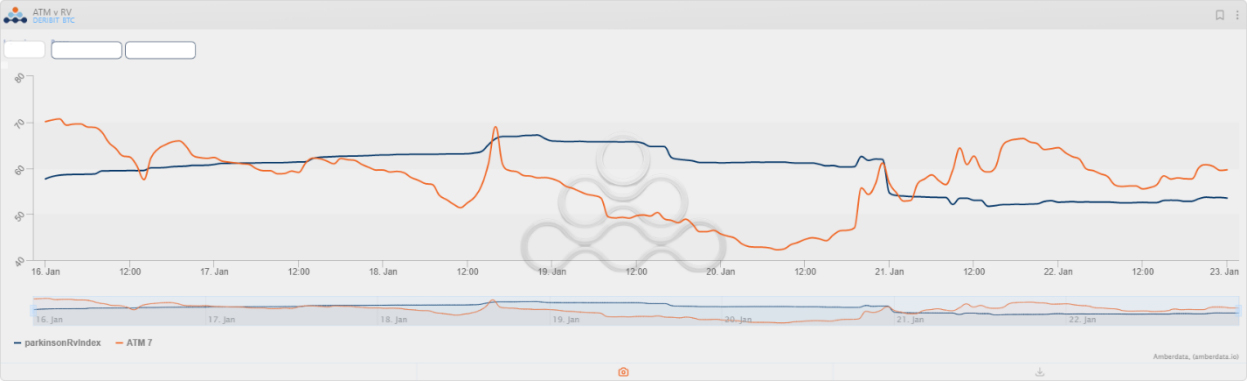
Figure 2. ATM vs RV (Weekly) BTC
A very similar picture is portrayed in the ETH markets with ETH RV currently around 58. Historically the spread between BTC and ETH in both IV and RV has been much wider. However, given the recent moves have seemingly been driven by BTC first, the increased realized and implied volatility in BTC compared to historical data is in line with what one might expect given the conditions.
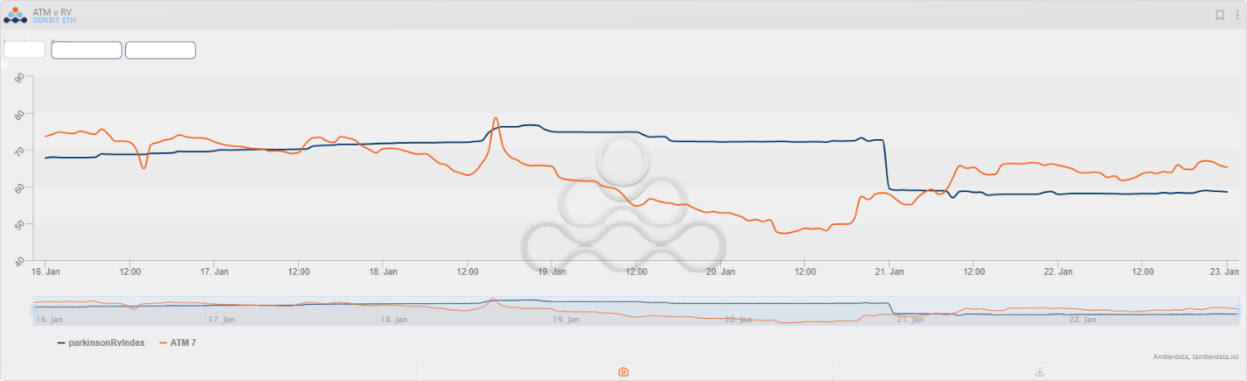
Figure 3. ATM vs RV (Weekly) ETH
Skews for BTC and ETH
Skew in BTC and ETH both significantly blew out this week, highly favoring calls with around an 8-hour timeframe in which 25 delta call skew had traded at double digit IV premiums ranging from 10-14 in the January 27 th expiry coming up. Currently call skew is in the mid-single digits (5.3 IV) in the January 27 th tenor with the next largest expiries in February and March showing around a 3-4 IV point premium
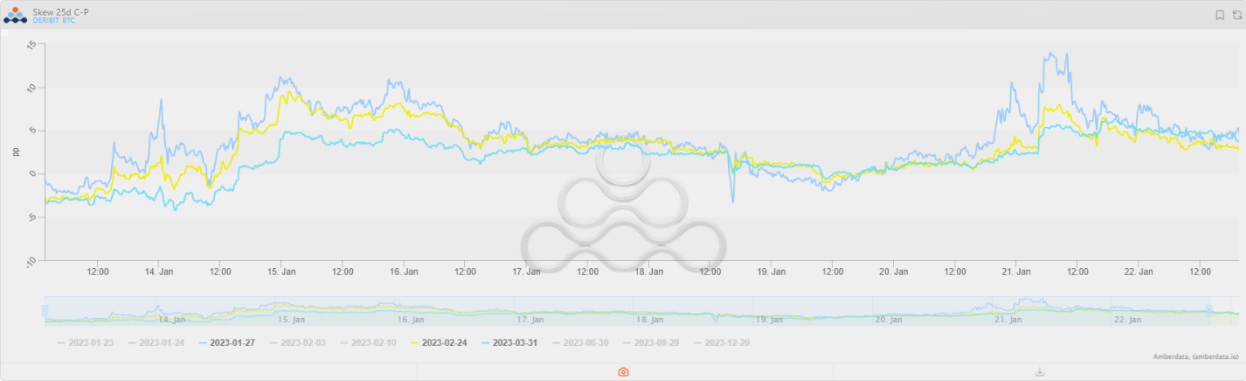
Figure 4. Various 25D Skews (BTC)
A similar trend in ETH had occured as well, however the double-digit IV premium on Saturday was not replicated in ETH options for the same length of time. Additionally, ETH skew is looking to revert back to the recent historical norm of puts at a premium as the March tenor shows calls only trading at a mere 0.38 IV premium.
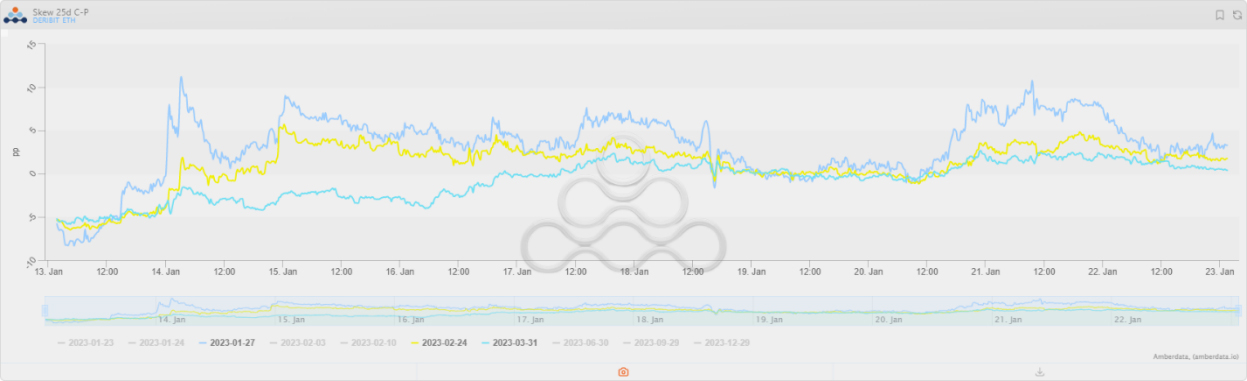
Figure 5. Various 25D Skews (ETH)
Term Structure for BTC and ETH
Looking around 3 days back starting on Friday around 00:00 UTC, we can see the sharp move in BTC near the end of the US afternoon session pushing front end vols up slightly while the further dated end of the curve stays relatively fixed, especially after the June 30 th expiry. In both BTC and ETH the sharp backwardation prior has reverted back to a flatter looking term-structure, although short-dated expiries still have a bit of a premium.
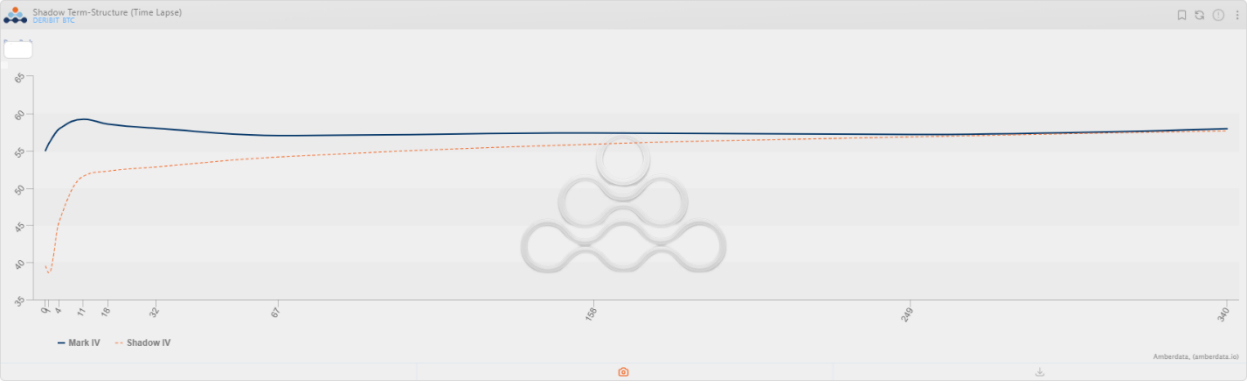
Figure 6. Term Structure Monday vs last Friday 00:00 UTC (BTC)
Although the front end of the term-structure in ETH shows a relatively similar picture regarding a slight elevation, the longer dated end of the curve past the March expiry starts showing a noticeable shift lower,. Perhaps the recent momentum and macro driven trades have driven longer dated IV up to levels traders feel comfortable starting to go short. As they speculate on the impact of any longer-dated ETH Shanghai narratives. ETH previously has shown signs of dislocation from BTC in some of these more event-based trades, and selling upside vol before the merge to expire after was a winning trade.
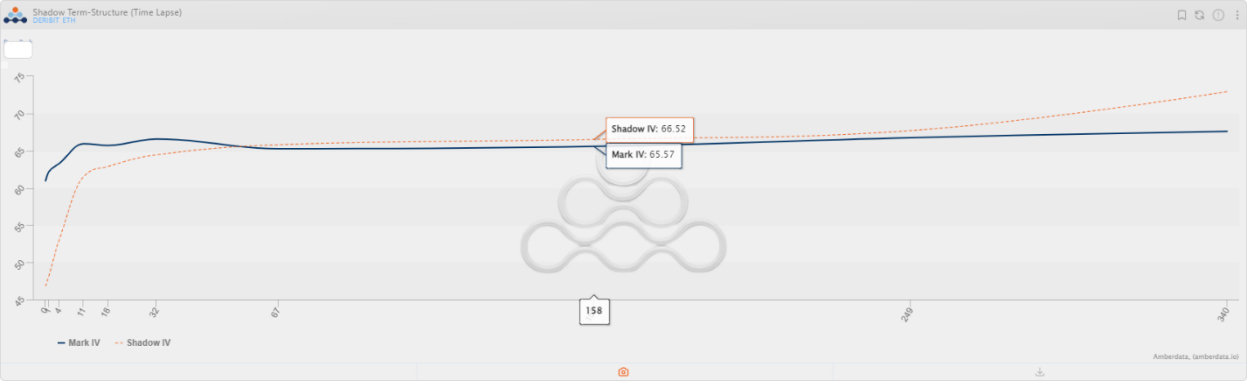
Figure 7. Term Structure Monday vs Last Friday 00:00 UTC (ETH)
Noticeable Flows Throughout the Week
Short-dated upside call buying in BTC was a prevalent trading theme last week as strikes between $22K all the way to $28K were purchased in blocks on Paradigm. In ETH a similar bullish pattern has started to appear, however this bullish thesis was executed through call spreads – perhaps taken on by those wanting a directionally biased bet without the need to be exposed to historically elevated call premiums.
Even after the Friday/Weekend rally, the large open interest in some of the BTC calls has stayed elevated, with Amberdata’s charts for the January 27 th expiry showing not much decline in open interest save for around 154 of the 22K calls potentially closed out. Perhaps suggesting those who own these calls are fine with any theta decay or any loss from a decline in near-term volatility or reversal of the current move and are instead speculating on further upside potential in BTC. Additionally, as this was noted during the most recent 24 hours, weekend liquidity may have been poor and there may be the expected profit taking throughout the week.
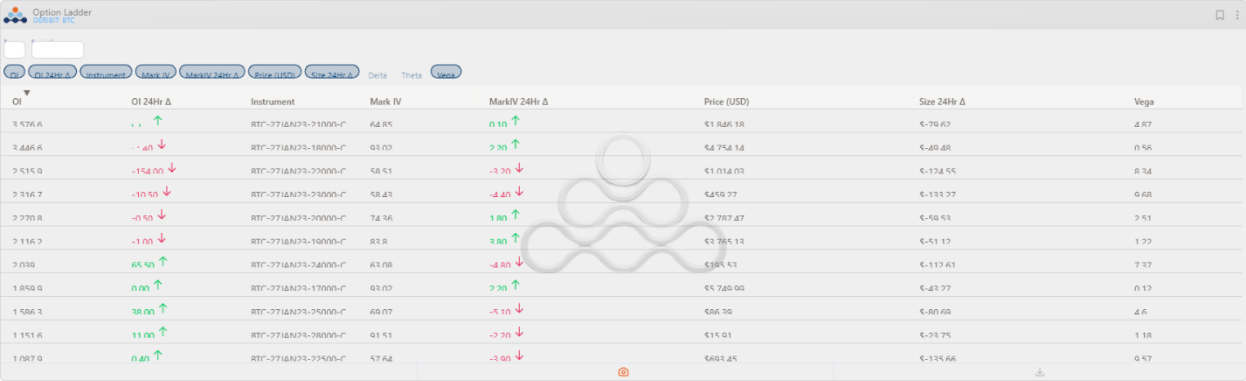
Figure 8. BTC Option Open Interest Change Over Past 24 Hours (1-27 Expiry)
Paradigm covers additional flows in their Tweet below.
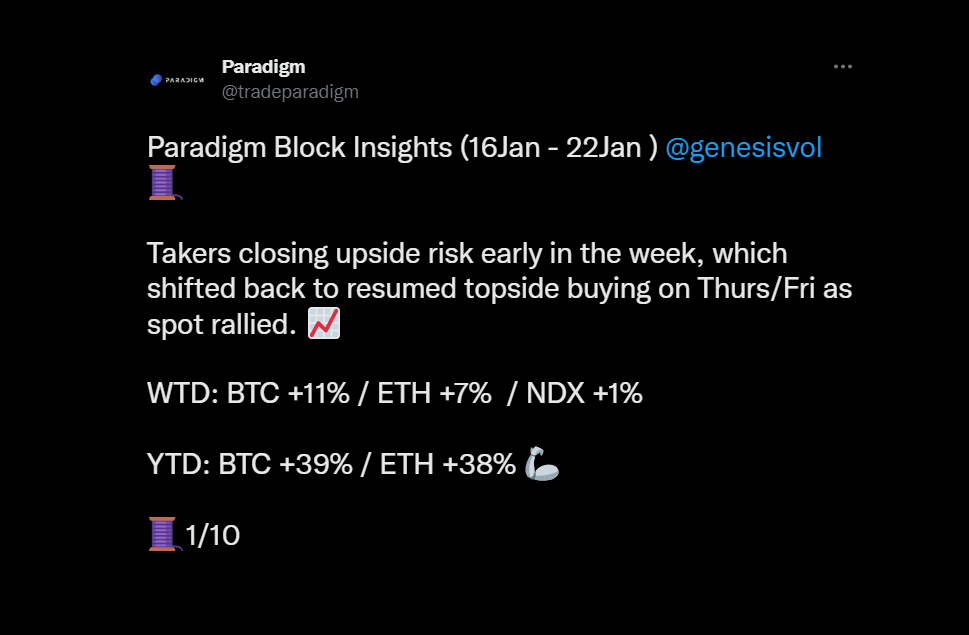
Twitter Thread by Paradigm
Liquidations/OI
This most recent move may have also been driven by short liquidations into poor liquidity as one can note the price action below. A large amount of perpetual open interest was closed out as price rallied, given the timeframe and CVD one can assume these were shorts being liquidated.
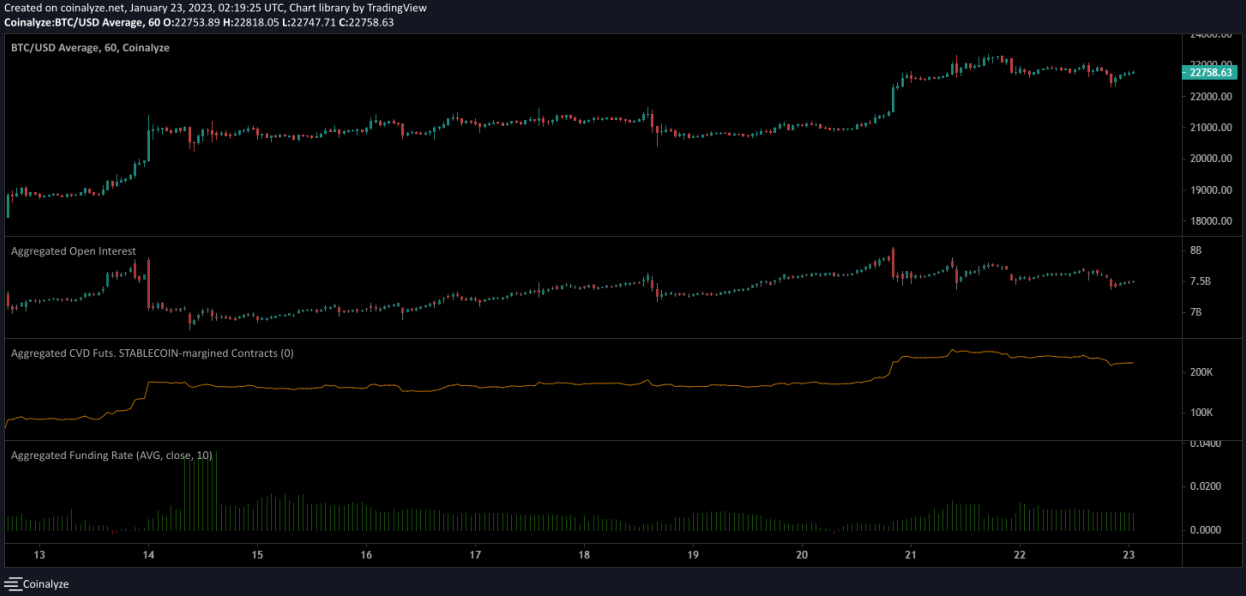
Figure 9. Coinalyze Chart Showing OI, Funding, and CVD
Short liquidations saw nowhere near the amount liquidated on January 13 th during the move above 20K, however, this past week is still seeing short liquidations larger than most of November and December.
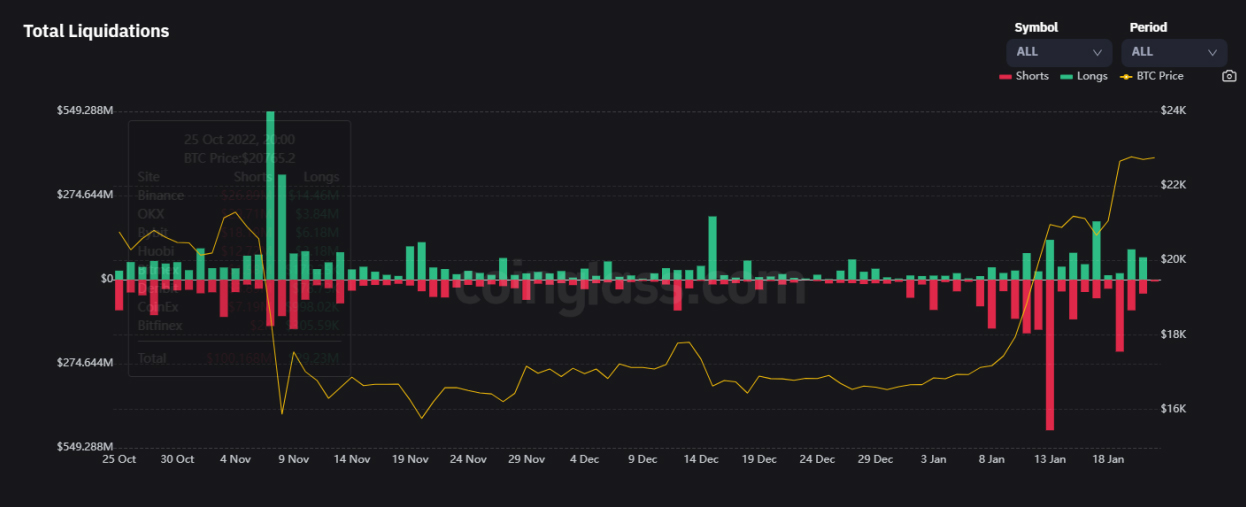
Figure 10. Coinglass Liquidations
A Look Ahead
Prior to the FOMC and given the recent liquidations the past week, one might expect a bit of a calmer week ahead. However, given the dealer short-gamma inventory and large expiry winding down at the end of the month, one should keep an eye on funding rate trends and short open interest accumulating while also staying cognizant of the recent moves happening during Friday’s US afternoon sessions.