Having tested the lower bound of November’s prices, and nearing the lengths of the two previous bear cycles, BTC’s sharp rally has sparked hopes of further upside price action.
Implied volatility has returned to more normal levels following the increase in realised volatility. However, the term structure of the volatility smile’s skew towards OTM calls/puts may suggest that, whilst not pricing for an explicitly bullish phase, the market is testing the idea that we may have seen the bottom in the current bear cycle.
Realised Volatility
Crypto-assets have long held a reputation as high-volatility assets. However, unlike in previous years of shaky paths to soaring highs, crypto-asset volatility in 2022 was experienced as a succession of sharp legs down in spot price that served to break up long periods of otherwise sideways price action. This behaviour is reflected by several spikes upwards in realised volatility in Figure 1, with spikes in March, May, June, and November of last year each beginning at the same time as a selloff in spot price.
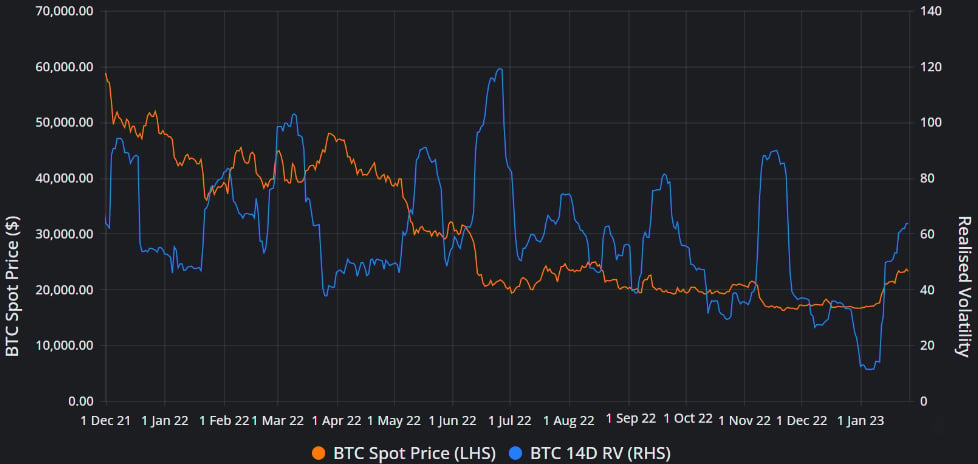
Figure 1 Daily history of BTC Spot Price (orange), and 14-day realised volatility (14-day rolling estimate of standard deviation of daily log-returns) from 1st Dec 2021. Source: Block Scholes
The distinctive columnar shape of those spikes is an artefact of the rolling window that is used to compute the standard deviation of the asset’s log returns. First, a single large move in spot price increases the volatility estimate at the beginning of the window. Then, that large move is followed by more of the low volatility environment seen before it, leaving price stagnant at the new level. The rolling estimate of realised volatility remains high until the singular, large move passes out of the lookback window (after 14 days in the chart above), causing the realised volatility to drop once again.
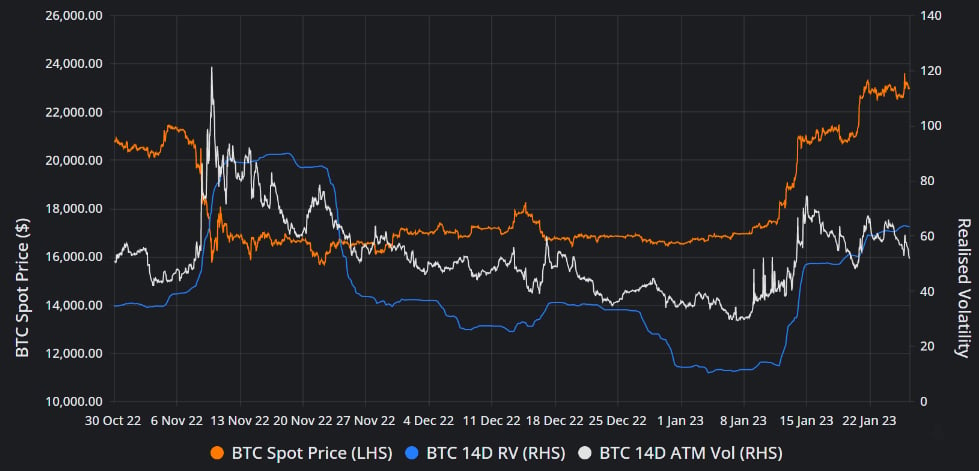
Figure 2 Hourly history of BTC Spot Price (orange), 14-day realised volatility (14-day rolling estimate of standard deviation of daily log-returns), and 14-day ATM volatility (white) from 30th Oct 2022. Source: Block Scholes
Whilst representing volatility in the opposite direction to previous moves, BTC’s and ETH’s rallies over the last two weekends suggest that we are continuing the same volatility regime that ended 2022: one of extended periods of inactivity interspersed with large moves up or down. Those rallies have followed nearly a month and a half of sideways price action around $16K – a period that recorded the lowest realised volatility in three years – with two step-wise moves upwards. Implied volatility has increased (now between 55% and 60%) in response to those moves, with a relative richness in short-tenor options that may indicate that traders believe these moves could be followed by a return to yet another sideways slog.
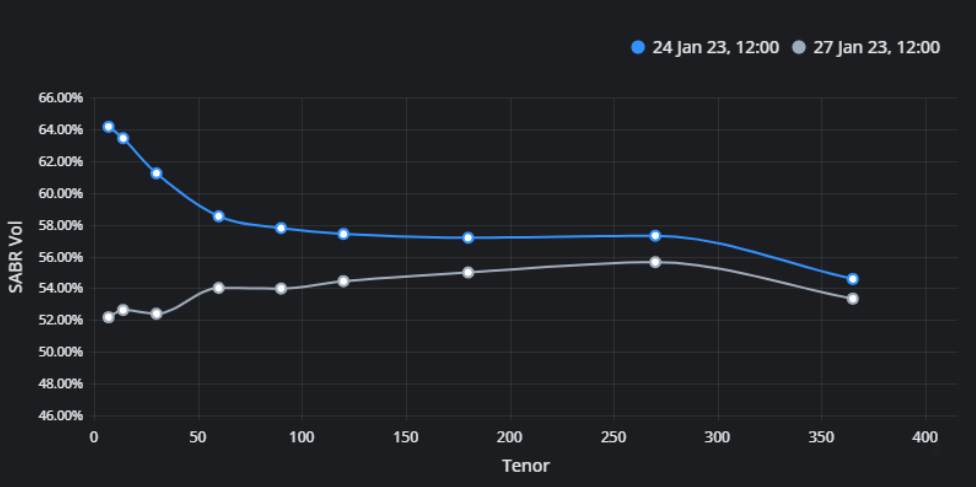
Figure 3 Recent term structure of BTC’s ATM implied volatility shows spikes in short-term optionality, with a return to lower implied vols at longer tenors. Source: Block Scholes
Skew Reversal
BTC’s volatility smile has been heavily skewed towards OTM puts since mid-2021, a point that became progressively more severe throughout 2022 as each spike in volatility took BTC spot price lower. That trend has been decisively reversed in the last two weeks, following two weekend rallies that saw BTC retake first the $21K and then the $23K price levels. Consequently, the volatility smile is now more skewed towards OTM calls than it has been since January of 2021.
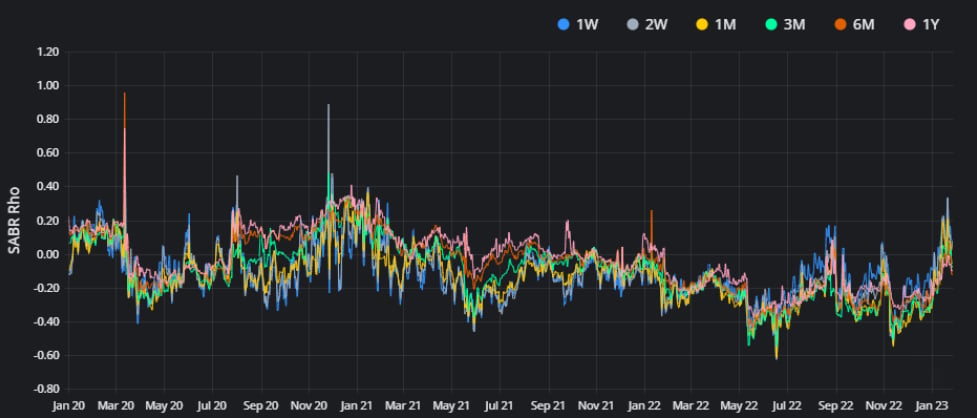
Figure 4 Daily history of BTC SABR rho parameter at standard tenors from 1st Jan 2020. Source: Block Scholes
That date preceded the first of the two rallies to ATHs in 2021 just three months later on Apr 14th. However, it is important to consider the context in which we last saw skews at these levels. In January 2021, the front end of the term structure was slightly skewed towards OTM puts, with longer-dated options expressing a preference for upside exposure. This indicated that, despite assigning a premium to short-term downside protection, traders held an optimistic outlook for BTC in the longer term.
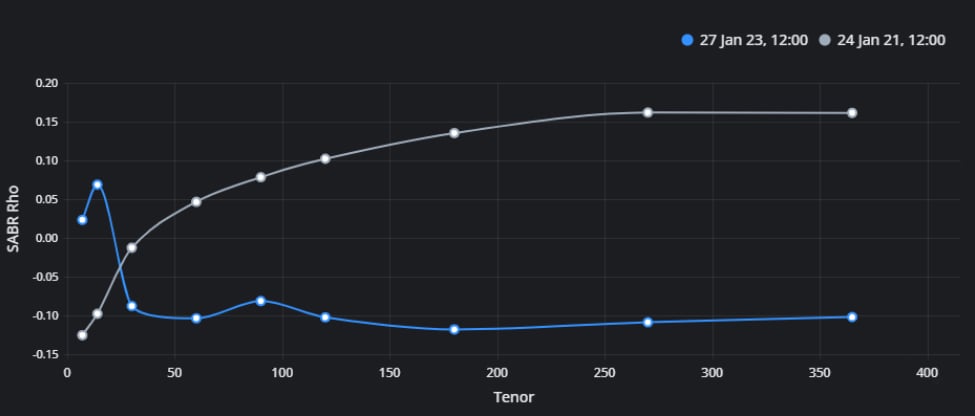
Figure 5 Term structure of BTC SABR rho parameter from 27th Jan 2023 (blue) and 24th Jan 2021 (grey). Source: Block Scholes
The SABR Rho parameter corresponds to the correlation between the underlying asset and its implied volatility parameter in the SABR calibration used to model the volatility smile. It also controls the skew of that calibration towards OTM puts or calls. Positive values indicate a premium of OTM calls relative to puts, whilst a negative value indicates the market’s preference for OTM puts.
This time it is the other way around. The term structure of skew is inverted, with short term options pricing OTM calls at a premium to OTM puts, and longer term options holding a preference for OTM puts. Despite reflecting a desire to participate in an immediate repeat of the previous two weekend rallies, it does not suggest that traders are committing to that bullish belief longer term just yet.