Crypto volatility report brought to you by our partner BlockScholes.
- ETH’s ATM implied volatility reacted more sensitively than BTC’s to the two spot selloffs in May and June.
- News of a prospective date for ETH’s switch to a PoS consensus mechanism inspired a rally in mid-July that was likely exacerbated by the liquidation of short positions in leveraged perpetual swap markets.
- As a result, ETH’s ATM remains 20 volatility percentage points higher than BTC’s today, and its skew turned towards OTM calls at a 7-day tenor.
- Historically, a positive skew at a 30-day tenor has resulted in ETH’s 1M returns improving against their long-term trend.
- If this happens then we may see a confirmation of the change in sentiment about ETH’s future price action.
ETH Volatility Spikes
After two turbulent months in its spot markets, ETH’s ATM volatility now trades just below 100% at all tenors less than 1Y, significantly higher than the 60-70% range that we saw at the beginning of May. Whilst closely tracking the same inflation narrative as equities and other “risk-on” assets, ETH’s derivative markets have responded most strongly to two large spot selloffs in mid-May (LUNA crash) and mid-June (Celsius and 3AC crises), resulting in a huge increase in demand for shortterm optionality and with it a drift higher of demand for longer-term protection. In the aftermath of each selloff, ETH’s ATM volatility settled 20 vol percentage points higher: rising from 60 to 80% before and after the crash in May, and from 80% to 100% in June where it continues to trade today.
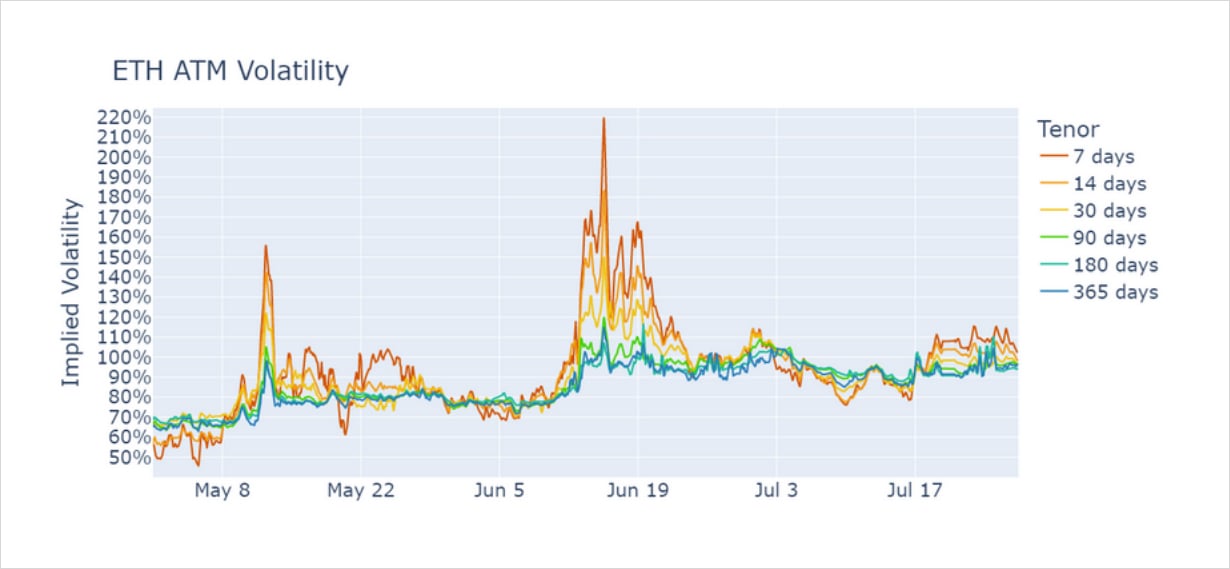
Figure 1 ATM implied volatility of Deribit traded ETH options at standard tenors. Source: BlockScholes
ETH Vol Smile Skew
Whilst short-dated tenors outperformed other tenors during each crash, ATM vol was raised by uniform levels across the term structure once the dust had settled. In both cases it is clear that the new, higher level of ATM vol was caused by the market’s fear about further selloffs, a fact evidenced by the evolution of the “rho”
parameter in the SABR volatility smile calibration over that time frame. This parameter measures the skew of the volatility smile to OTM calls or puts, with positive values reflecting the relative demand of OTM calls and negative values indicating the market’s preference for OTM puts.
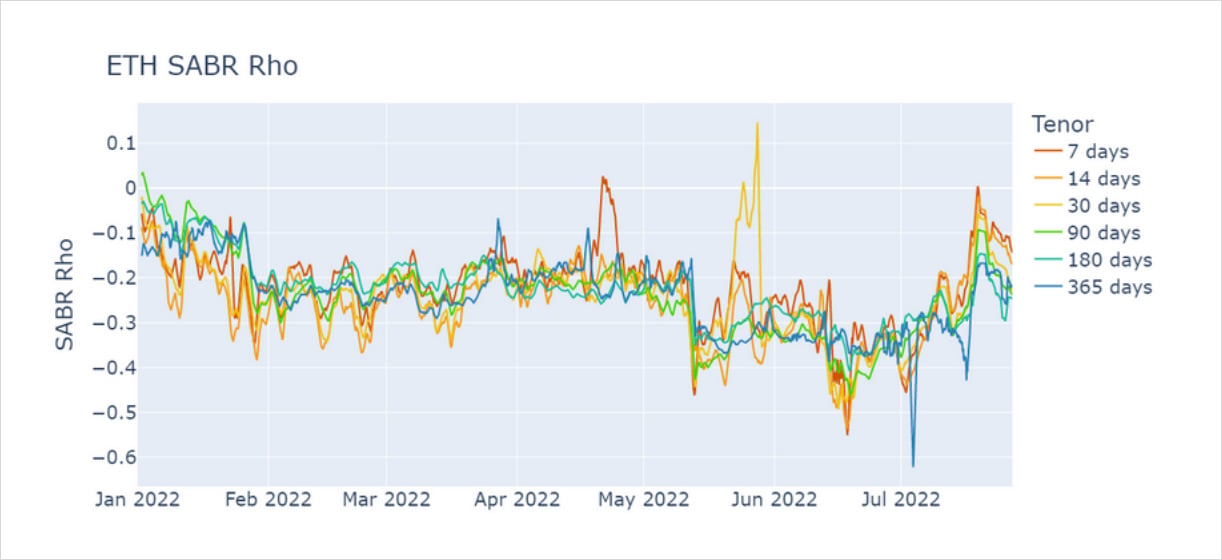
Figure 2 Evolution of the skew parameter in ETH’s SABR vol smile calibration since Jan 2022. Source: BlockScholes
As expected in times of panic, rho spiked downwards in the middle of both May and June as OTM puts became more attractive relative to OTM calls. That increased demand for downside protection contextualises ETH’s heightened volatility as fear about further downside price action, rather than hopes of a dramatic recovery. However, despite fear spiking during each crash, the chart also shows that the market remained pessimistic throughout the intermissive periods of relative calm, continuing to assign a premium to downside protection against the next selloff.
Since the beginning of July, however, the vol smile has suggested a cooling in the relative richness of OTM puts. This culminated on the 18th of July when the smile even skewed towards OTM calls at short tenors. At the same time, ATM vols rose above 110% at short tenors, with options at all tenors shorter than a year implying volatility above 90%. An increase in ATM vol in conjunction with a reduction in skew is unusual for this period, and suggests a shift in the market’s belief about future price action as the latest spike in volatility is not as clearly directional as the previous two.
Historically, the smile’s skew parameter has held significant information about future spot prices. Below is the cumulative distribution function of ETH’s detrended 1M returns conditioned on a positive rho value, estimated from hourly spot price and SABR data from the 1st of January 2020 until the 30th of July 2022. This shows the percentage of occasions (y-axis) that a positive rho value has resulted in at less than or equal to a given return above the trend (x-axis). This chart therefore evaluates the accuracy of the market’s expectations of ETH returns relative to their long-term trend after 30-day tenor options imply a skew towards OTM calls.
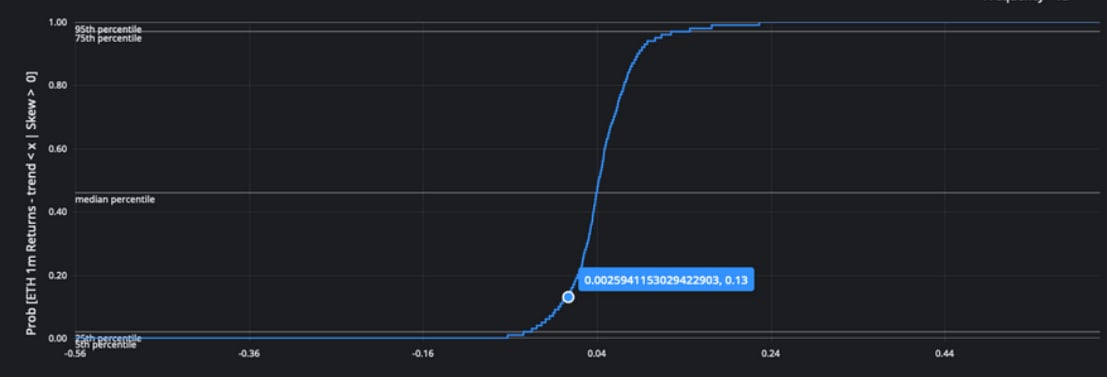
Figure 3 Cumulative distribution function of detrended 1M ETH returns conditioned on a positive rho parameter, estimated from hourly spot price and SABR data from the 1st of January 2020 until the 30th of July 2022. Source: BlockScholes
The chart shows that ETH’s 1M returns have failed to outperform their long-term trend only 13% of the time. This means that a positive rho parameter has indicated an improvement in 1M returns 87% of the time, signalling either a weakening in bearish sentiment or a strengthening in bullish conviction. We did not see the 30-day parameter turn positive on the 18th July, only the parameter at shorter tenors at 7 and 14-days. However, should the market react similarly to further news of the Merge’s progress, we could see ETH’s smile skew towards calls at tenors further into the future.
It is important to stress that this change to ETH’s skew was not a total reversal, but a weakening in the bearish sentiment that has dominated ETH’s narrative over the past three months. This change in outlook was also not uniform across the term structure, with smiles at longer-dated tenors retaining negative rho values throughout this rally. Finally, the pessimism implied by options has returned slightly since, as ETH’s smile has skewed back towards puts slightly since the 18th of July.
BTC vs ETH
The levels of ATM volatility implied by BTC options spiked in a similar way to ETH’s during both spikes in May and June, but took a leg up of only 10 vol percentage points in the aftermath of each crash in contrast to ETH’s two 20 vol point steps. That has resulted in a three month-long trend of ETH’s ATM vol outperforming that of BTC, an occurrence somewhat to be expected given the former’s larger downturn from November’s all-time highs.
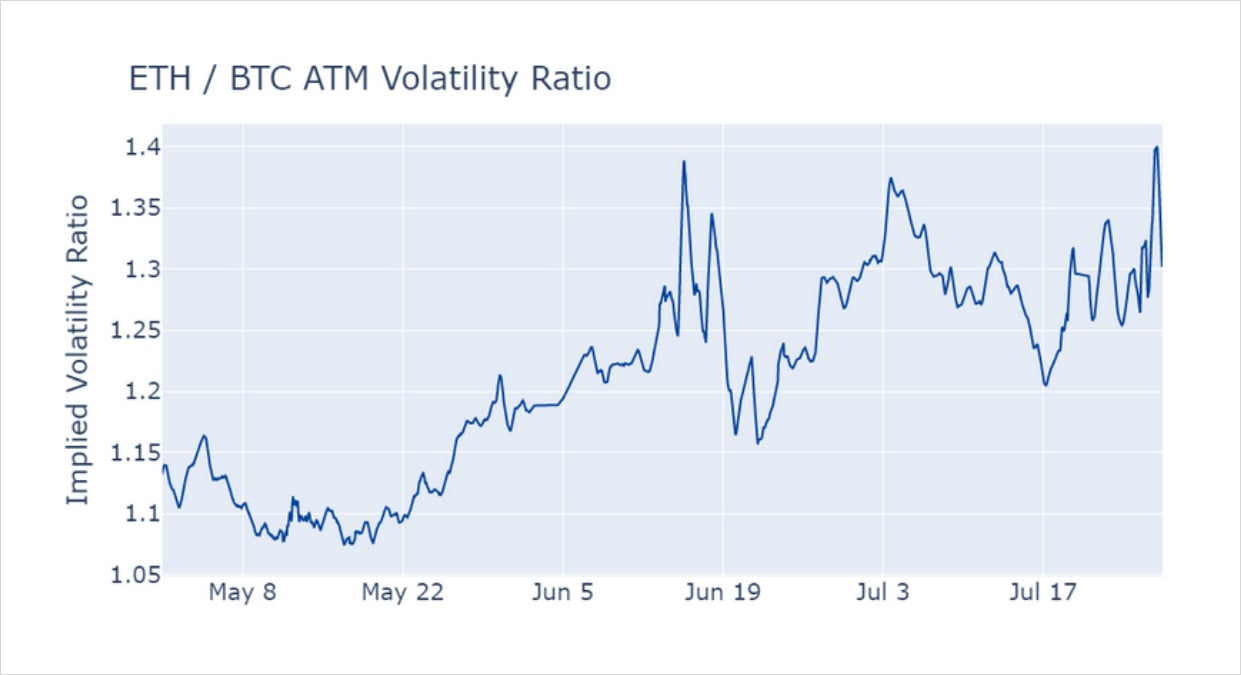
Figure 4 ETH ATM volatility at a 3M tenor divided by the IV of equivalent BTC options Source: BlockScholes
Figure 4 shows the ATM volatility of ETH options at a 90 day tenor divided by the ATM vol of equivalent BTC options. We observe that the long term trend upwards of ETH vols compared to BTC’s is punctuated by turbulent spot market behaviour in mid-June. In this period, the short term volatility of both assets is itself very volatile, resulting in a changeable ratio between the two vol series. Once the panic subsides into late June, however, ETH’s levels are consistently more than 1.3 times that of BTC’s and rising.
Unlike the return to June levels by ETH’s skew, ETH’s ATM vols continue to trade around 20 vol percentage points higher than BTC options at all tenors less than 1Y. We note that the term structures of both assets are currently remarkably flat, indicating the high demand for both short- and long-term optionality in both assets. As a result, ETH’s vols are around 1.3 times higher than BTC’s at all tenors less than 1Y.
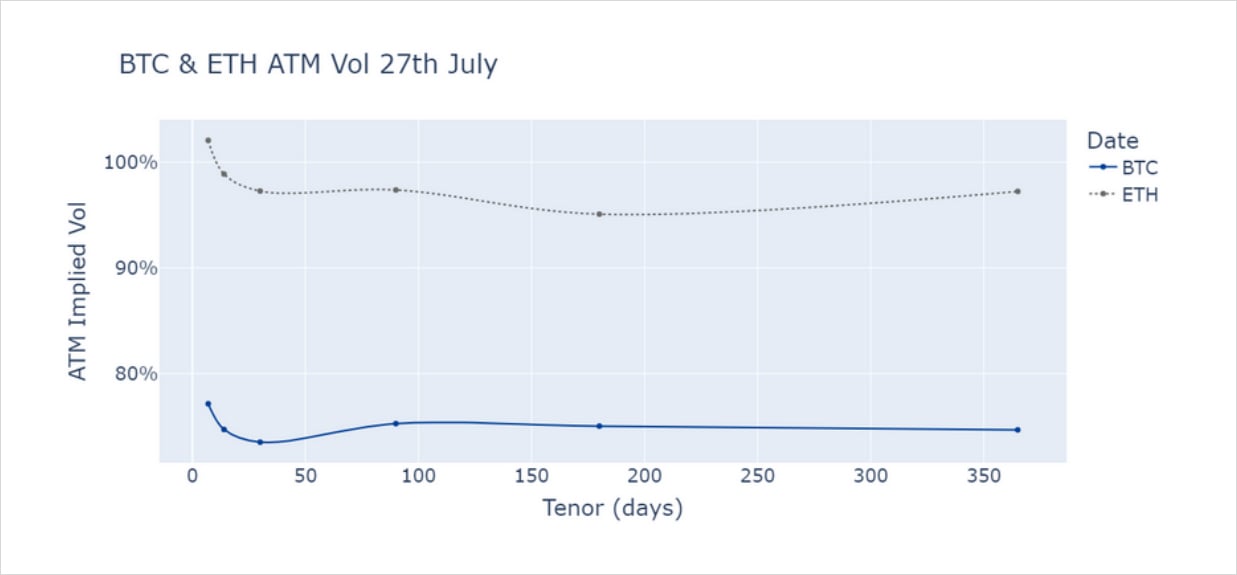
Figure 5 Term strucutre of both BTC’s (blue) and ETH’s (grey) ATM volatility on the 27th of July. Source: BlockScholes
BTC Skew
BTC’s skew towards puts has also largely followed a similar trajectory to that of ETH during the same period, with rho spiking downwards in May and trending closer to zero since the large negative levels in mid-June. However, where ETH saw a drastic reduction in its skew towards OTM puts in mid-July, BTC’s reaction was more reserved. Unlike ETH’s, BTC’s skew did not turn positive and has now resumed its longer-held trend, with the exception that shorter tenors are less pessimistic than the longer term with less of a skew towards puts.
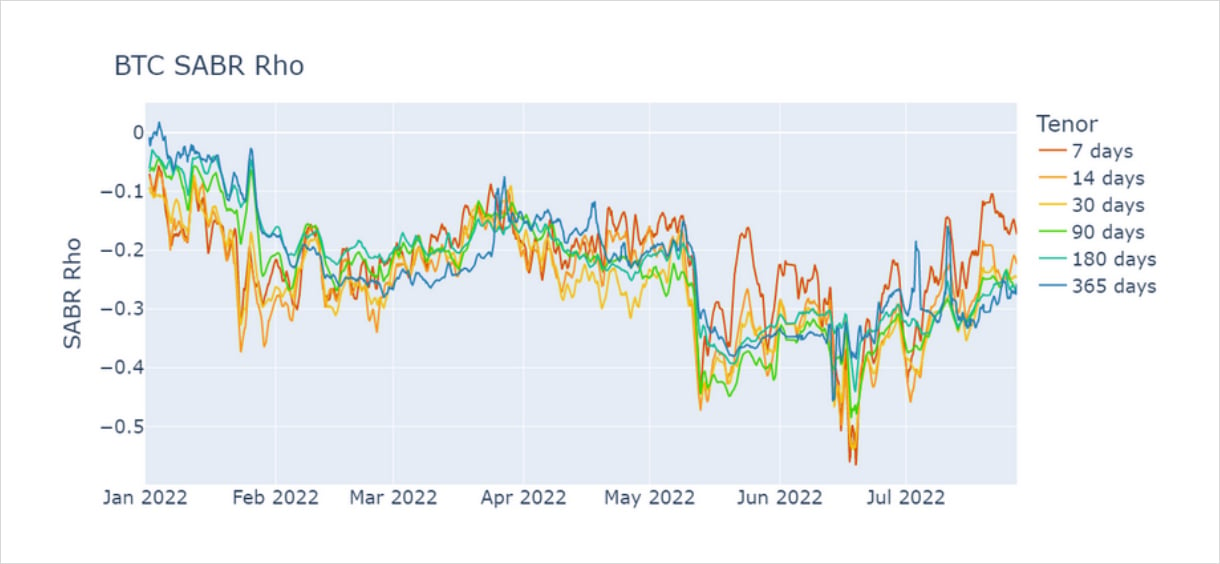
Figure 6 Evolution of the skew parameter in ETH’s SABR vol smile calibration since Jan 2022. Source: BlockScholes
That discrepancy is attributable to recently released news regarding a prospective date for ETH’s Merge. It was announced on July 18th that the long-awaited switch of Ethereum’s execution layer to a proof of stake consensus mechanism was expected to be completed by September 19th. The strong positive reaction to the announcement shows that traders are very bullish about the switch, as they briefly reversed a 6 month-long held trend of negatively skewed smiles.
It is possible that this move upwards in spot price was exacerbated by the forced liquidation of short positions in perpetual swaps, which automatically places a buy order in ETH denominated perpetual swaps to close out the position. This process also charges the liquidated trader a fee that is paid into the exchange’s insurance
pool, which allows us to track the daily value of positions that are forcibly closed using its balance of. We can couple this information with ETH’s spot price to make a judgement of whether those forced liquidations were of short or long positions, with the assumption that short positions are only liquidated during spot rallies and long positions are only liquidated during selloffs.
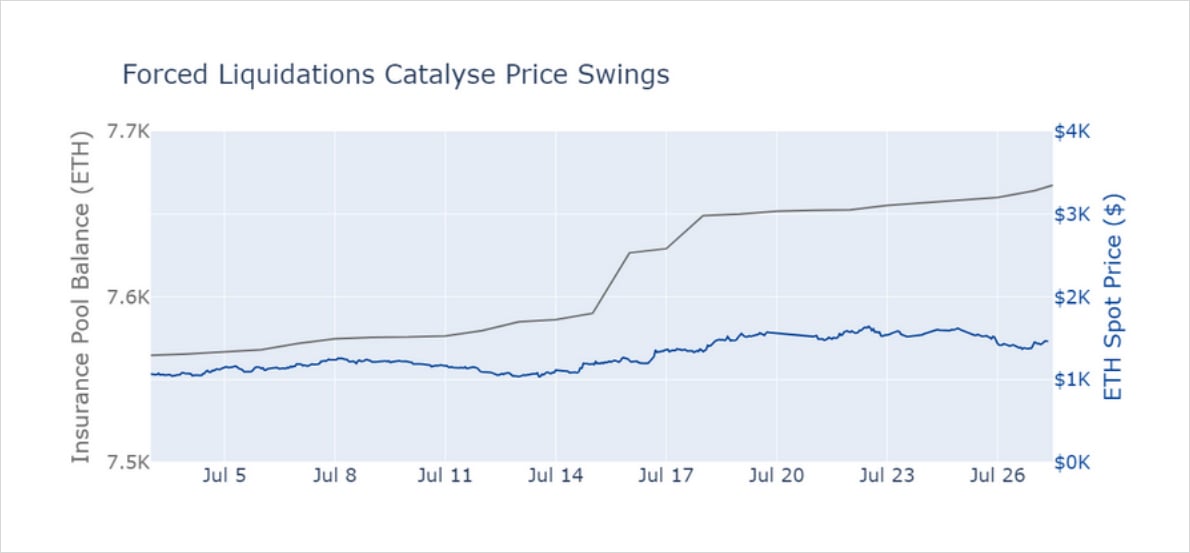
Figure 7 Balance of Derbit’s ETH insurance pool (grey) and ETH spot price (blue) during the rally in mid-July Source: Deribit
The balance of the insurance pool shows evidence of long positions being squeezed during both spot selloffs in May and June, as fees are collected as a result
of sharp downswings in price. Similarly, the pool collects fees when the price swings upwards too, penalising short positions who have been caught in the lurch by the positive news.
Whilst news of this announcement did significantly reduce ETH’s skew for all tenors less than a year, tenors with expiries earlier than the Merge date (which was at a 63 day tenor on the 18th July) significantly outperformed both longer-dated ETH tenors and equivalent-tenor BTC options. The term structure of Rho for both BTC and ETH showed significant weakening in the bearish sentiment at shorter term tenors without the same level of improvement at longer tenors, putting a time limit on the market’s newfound optimism.
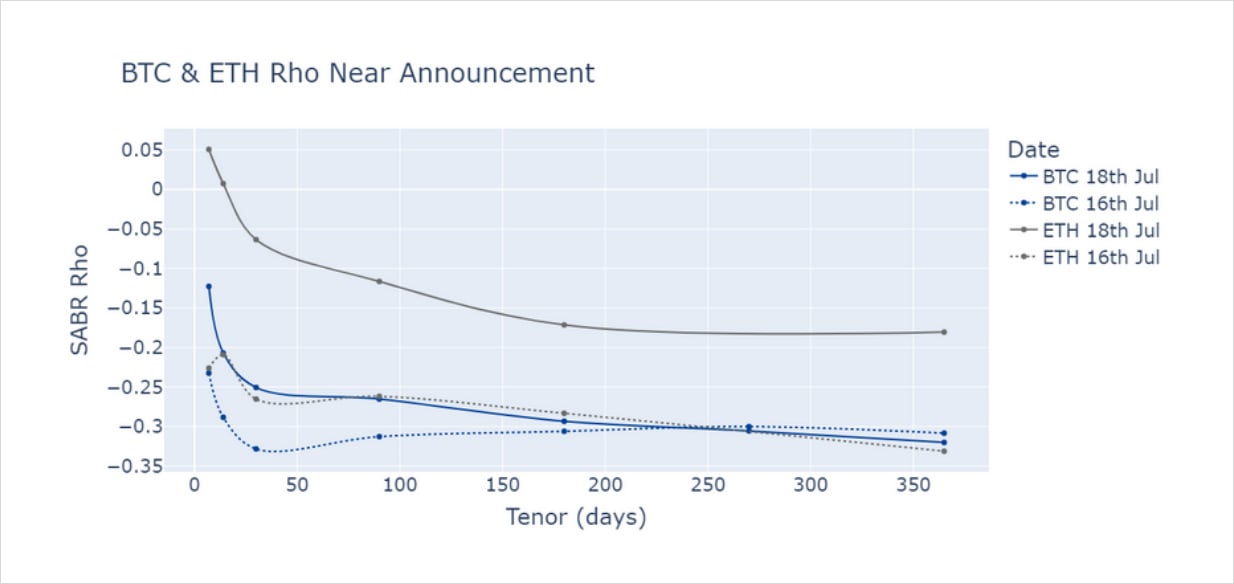
Figure 8 Term structure of the skew parameter for BTC (blue) and ETH (grey) before (dotted line) and after (solid line) news of a prospective date for ETH’s Merge Source: BlockScholes
Conclusion
Levels of ATM implied volatility increased for both assets during spot selloffs in May and June. However, ETH’s vols have reacted more sensitively, rising by 20 vol
percentage points in each case compared to BTC’s 10 vol percentage points. The skew of both assets has been trending downwards since the end of June, with
ETH’s smile even skewing towards puts briefly in mid-July at short tenors. Both asset’s smiles have since resumed their skew towards OTM puts, and so too has BTC’s ATM vol returned to the levels recorded at the beginning of June.
In contrast, ETH’s vols have not returned to those levels and remain 20 points higher than those of BTC across the term structure. This has coincided with a
significant reduction of short-term pessimism that aligns with a positive reaction to news of the switch to PoS. As this reaction was strongest for tenors dated before the Merge date, the traders may be expressing less conviction about the longerterm implications of the switch. This announcement has marked a significant shift in the market’s expectations about the direction of ETH’s volatility in the nearfuture and a confirmation of the asset’s departure from BTC’s ATM volatility levels.
If that shift in expectation continues, we may see ETH’s smile skew towards OTM calls, which has historically indicated an improvement in 1M returns against the longer-term trend.