Crypto volatility report brought to you by our partner BlockScholes.
Bitcoin Volatility and Difficulty
On the 31st of August, the bitcoin network’s difficulty parameter spiked by 9.2%, almost matching the all-time high recorded immediately before the Terra-induced market crash in mid-May. This occurred in spite of a falling BTC spot price and rising global energy prices impacting both the revenue and overheads of bitcoin miners respectively. We would have expected these factors to cause miners to stop mining, causing a fall in the total network hash rate and a consequent reduction in network difficulty.
The difficulty parameter controls how many attempts (on average) a miner must make before they would expect to successfully mine a block. A fuller discussion of difficulty and its relationship to price can be found in a previous Block Scholes report, available on request.
One explanation is that miners have chosen to keep mining, with the expectation that spot price will recover sufficiently to keep their activities profitable. However, this decision is costly in the short term, and mining operations generally run with incredibly tight margins. Many miners are therefore faced with either selling their mined BTC into a falling market or making use of derivatives to cover their operation costs. We speculate that a significant contingent of miners is choosing to sell deep OTM calls to augment short-term profits.
There is evidence for this in the skew of the volatility smile towards OTM puts over the previous two years (prior to this period, derivatives markets had no significant liquidity and infrequent contract expiries). Note that this window includes both the autumn bull run in 2021 and the subsequent crash beginning in January 2022. We measure the skew towards puts by via the Rho parameter of the SABR volatility smile calibration; the more positive that parameter is, the more extreme the skew of the smile towards calls. Therefore negative values in Figure 1 (right-hand axis inverted) indicate that the implied volatility of OTM puts is high relative to calls of similar moneyness.
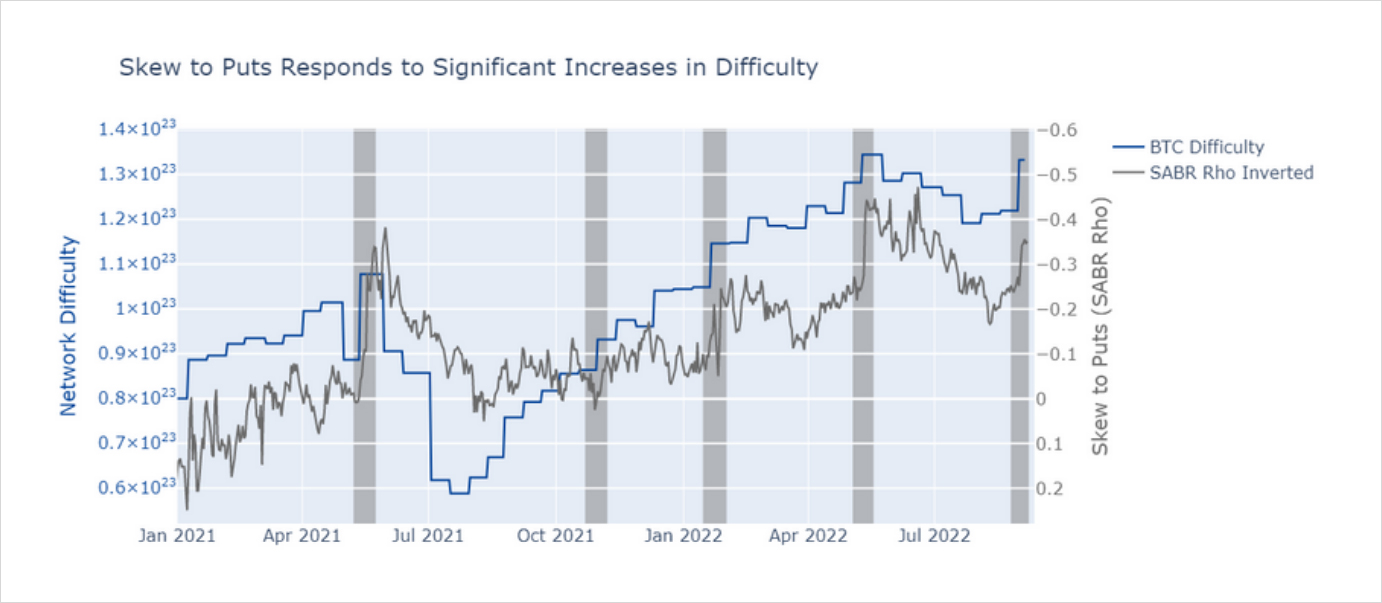
Figure 1 Daily history of BTC’s SABR Rho parameter (grey) with Network Difficulty (blue) since Jan 2021. SABR Source: Block Scholes, Difficulty Source: Blockchain.com
Figure 1 shows that parameter spiking in response to significant increases in difficulty (left-hand axis), skewing heavily towards puts on several occasions. This means that OTM calls were cheapening much more aggressively than OTM puts, which we believe can be explained by miners increasing the supply of OTM calls in the market. We would not expect a decrease in hashrate to have a significant effect on the shape of the smile as miners would enjoy an increase in their expected profits and so not need to sell options. In such cases, we find no statistically significant evidence for a relationship between drops in difficulty and Rho.
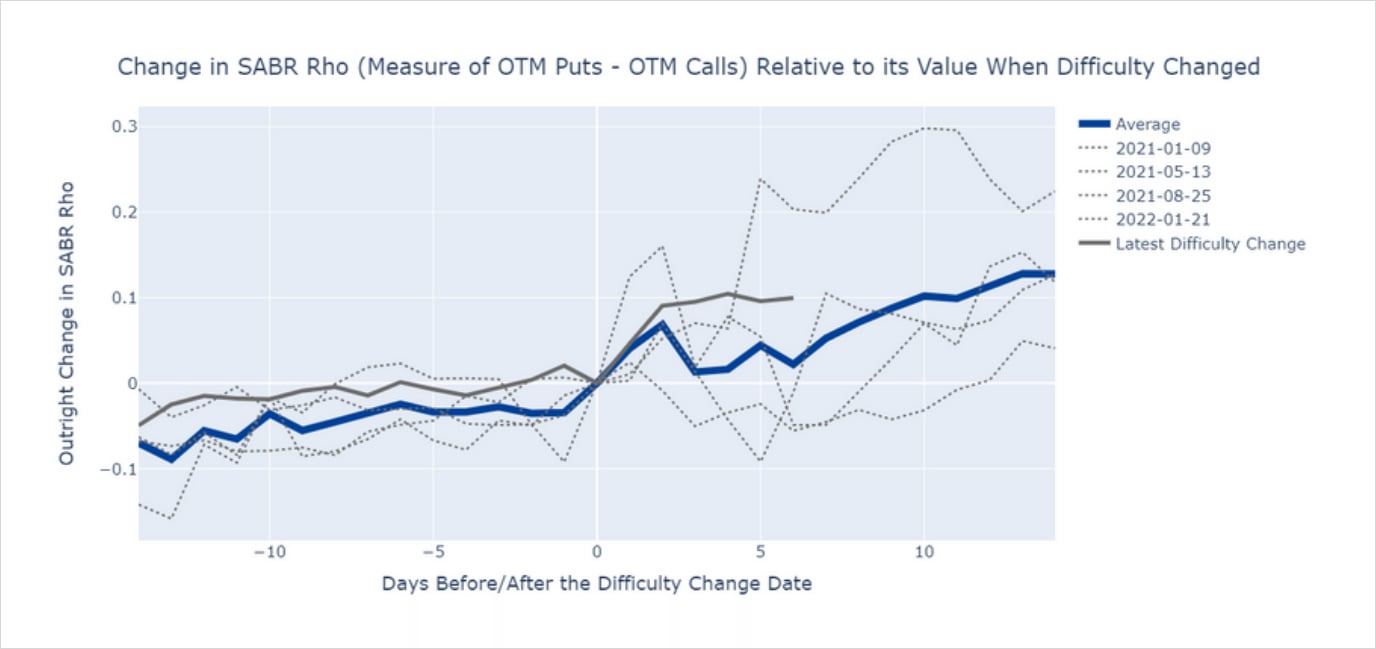
Figure 2 Change in SABR Rho 14 days before and after Network Difficulty increased by 9% or more. Average of all timeseries plotted in blue, and latest response to difficulty increase in solid grey. Source: Block Scholes
The reaction of the derivatives markets to the changes in difficulty is clearest in Figure 2, which shows the skew towards puts 14 days before and after a significant increase (of 9% or more) in network difficulty. We plot the value of the skew above or below the value recorded on the day of the change at each timestamp. Plotted in blue is the average of each historical time series.
Between 3 and 5 days after the difficulty is increased the smile increases its skew towards puts significantly, with the trend weakening further from the date of the change. This trend begins even before the date that the difficulty is changed, likely because miners have advanced knowledge of the upcoming difficulty switch via the implied hashrate of the network, an estimate of the total computing power devoted to the network by miners in aggregate. Miners are not waiting for the difficulty to impact their profit margin to begin selling options, but are preparing for a drop in their expected revenue beforehand in reaction to the estimated hashrate.
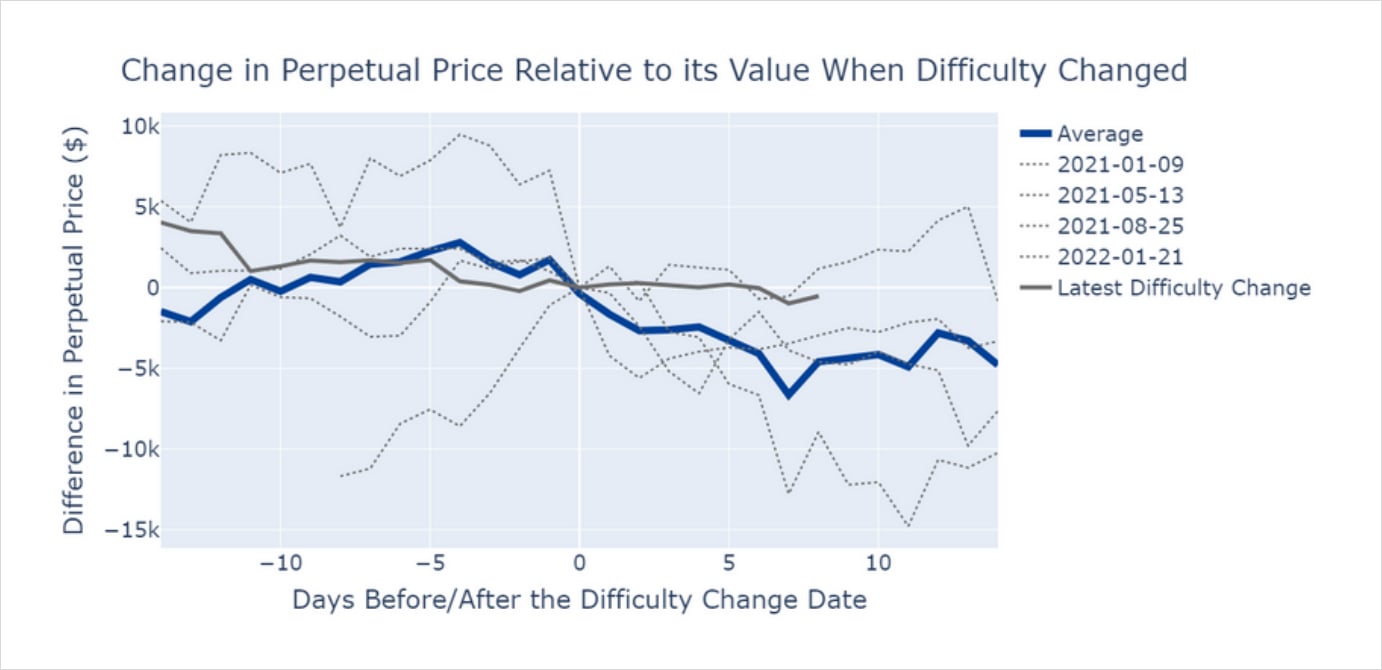
Figure 3 Change in Perpetual Swap price 14 days before and after Network Difficulty increased by 9% or more. Average of all timeseries plotted in blue, and latest response to difficulty increase in solid grey. Source: Block Scholes
Miners’ actions also appear to result in downward pressure on the price of the perpetual swap, a futures product commonly used as a hedging instrument due to the attractive leverage it offers. We believe that the drop in price of the perpetual could be due to market makers covering their delta from the OTM calls sold to them by the miners by going short the underlying or, as is the perpetual, an instrument highly correlated with it. Doing so leaves them ambivalent to the direction of the underlying, but long volatility. This turns out to be an attractive position given the effect difficulty increases have historically had on ATM levels.
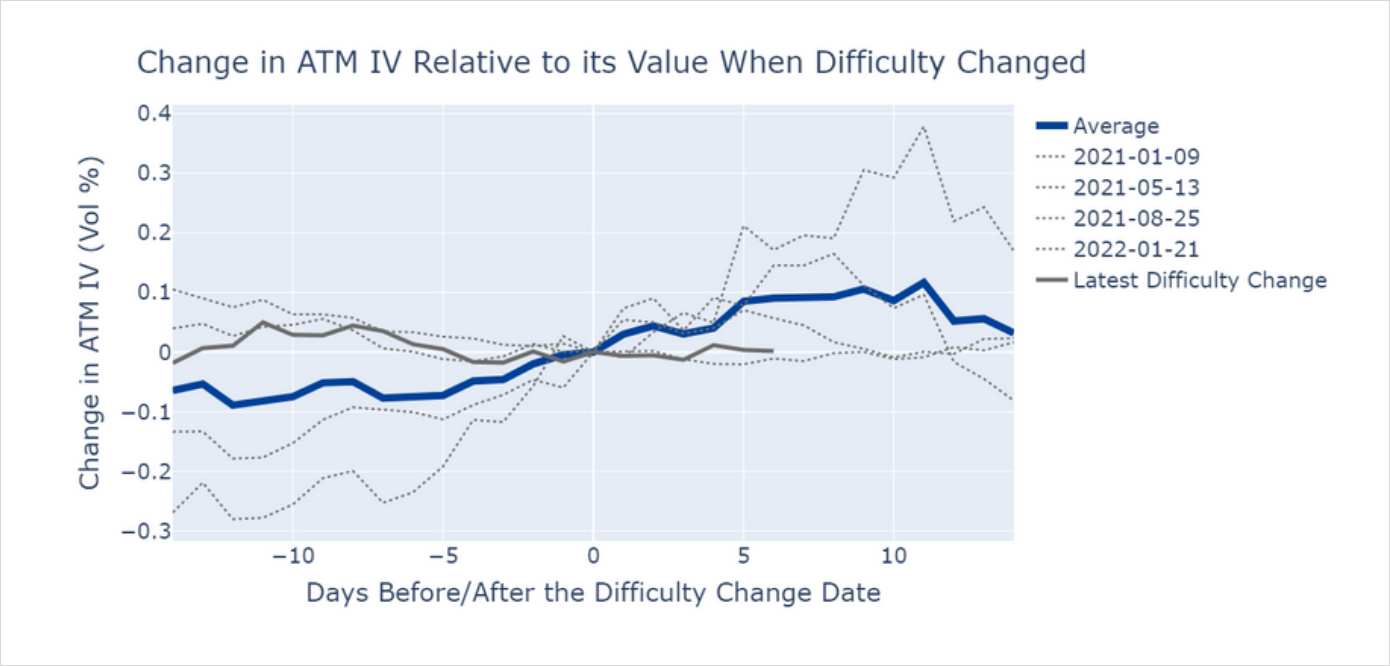
Figure 4 Change in ATM implied volatility 14 days before and after Network Difficulty increased by 9% or more. Average of all timeseries plotted in blue, and latest response to difficulty increase in solid grey. Source: Block Scholes
The one parameter that is at odds with the above narrative is ATM volatility. Figure 4 shows the vol point changes in ATM volatility immediately before and after significant difficulty increases. Like the impact on the put skew, outright volatility increases by an average of 10 vol points in the 10 days following a spike in difficulty. We would expect the trend of ATM vol to follow the behaviour indicated by the price of the BTC perpetual as market makers look to hedge their volatility exposure from the OTM calls by selling ATM options. One explanation is that most of the OTM selling is in short expiries, which has a low volatility exposure (vega), which may not be worth hedging.
After the most recent change in difficulty, the price of the perpetual did not drop as we have come to expect given the average response to such a large increase in network difficulty over the previous 2 years. Despite this, the spike in skew towards puts is near the top of its historical range. This suggests that whilst miners are still hedging their exposure to difficulty by selling OTM calls, the market makers buying those calls are choosing not to hedge their delta given the low levels of BTC spot price.
We will be interested to see if the relationship between these three metrics corrects to its long-term trend, or if market makers are validated with an increase in BTC spot price.