For those in the crypto space, 2022 has not been short of surprises. Whether it be an entire L1 blockchain imploding overnight or a prominent exchange commingling user funds, the past few months have been interesting. Despite the carnage in this industry, the crypto options market is still chugging along, with traders structuring positions to speculate and hedge their risk. Unlike trading spot or futures, option structures can give traders the ability to collect income amidst choppy or bearish market conditions.
In this research piece, we will explore one of these commonly traded option structures: the risk-reversal (RR). To aid our analysis, we will reference an academic paper written by veteran option traders which outlines the profitability of trading RRs in traditional markets. For the purpose of this research, we will focus exclusively on BTC options trading on Deribit and look for opportunities to make money across both bear and bull markets. This research piece will be organized as follows:
- Overview of the Risk-Reversal Structure
- Analyze Backtested Returns
- Summary and Next Steps
Overview of the Risk-Reversal Structure
Before we delve into the details of the academic paper, it’s important to understand the mechanics of trading RRs. As shown below, we can define buying a RR as selling an OTM put and buying an OTM call (the delta of the call and put should be nearly the same).
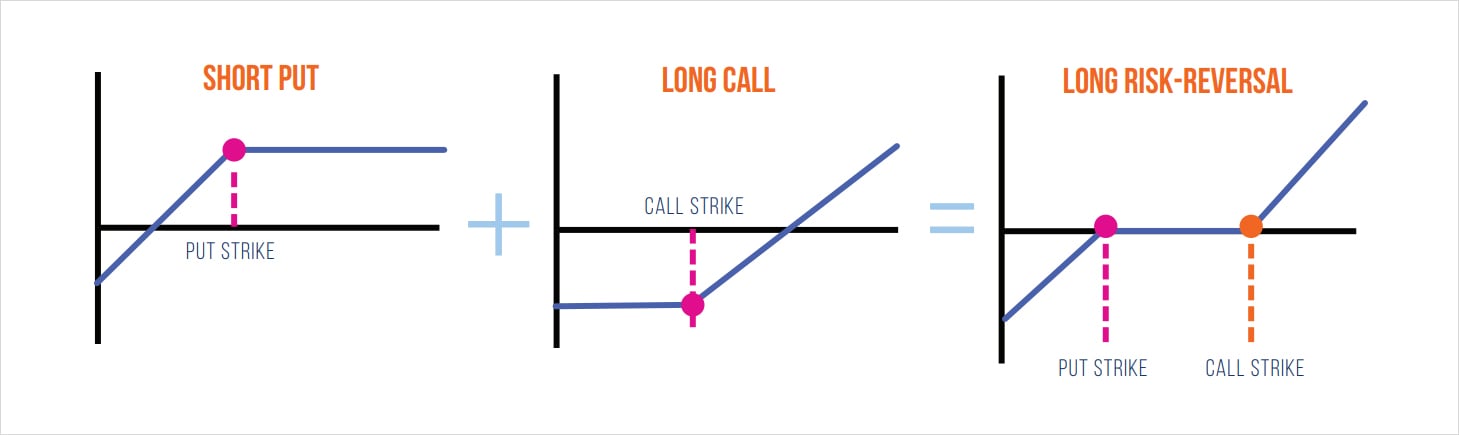
Conversely, selling a RR will involve selling an OTM call and buying an OTM put.
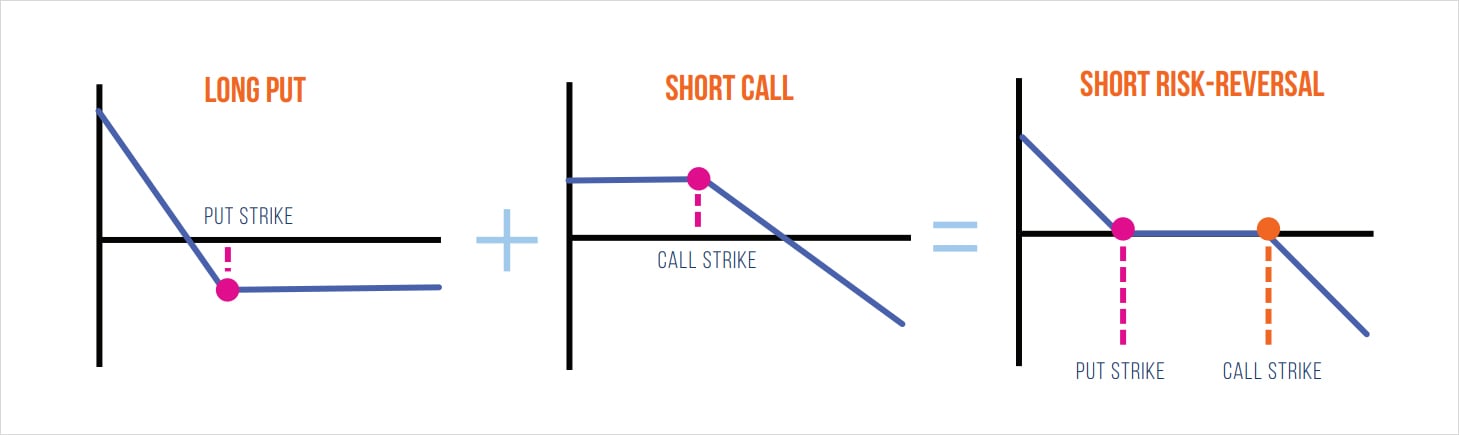
Depending on the strikes chosen, buying a RR is similar to being long the underlying, whereas selling the RR is similar to being short the underlying. However, as volatility traders, our primary goal is to trade volatility rather than the direction of BTC (also known as delta). For this reason, it’s common to see option traders hedge their delta exposure with futures contracts to eliminate any impact of price movements – which keeps their P&L clean and focused on trading volatility. Specifically, the hedged RR is a bet on the relative value of puts and calls.
At this point we can turn our attention to the option’s vega which will be critical in understanding the dynamics of how RRs are traded. As a refresher, an option’s vega exposure represents how much the option price will change for a 1% change in implied volatility. An option’s vega is at its peak when the option strike is near the current price of the asset. Below, we can visually analyze the net vega exposure of being long and short a RR.
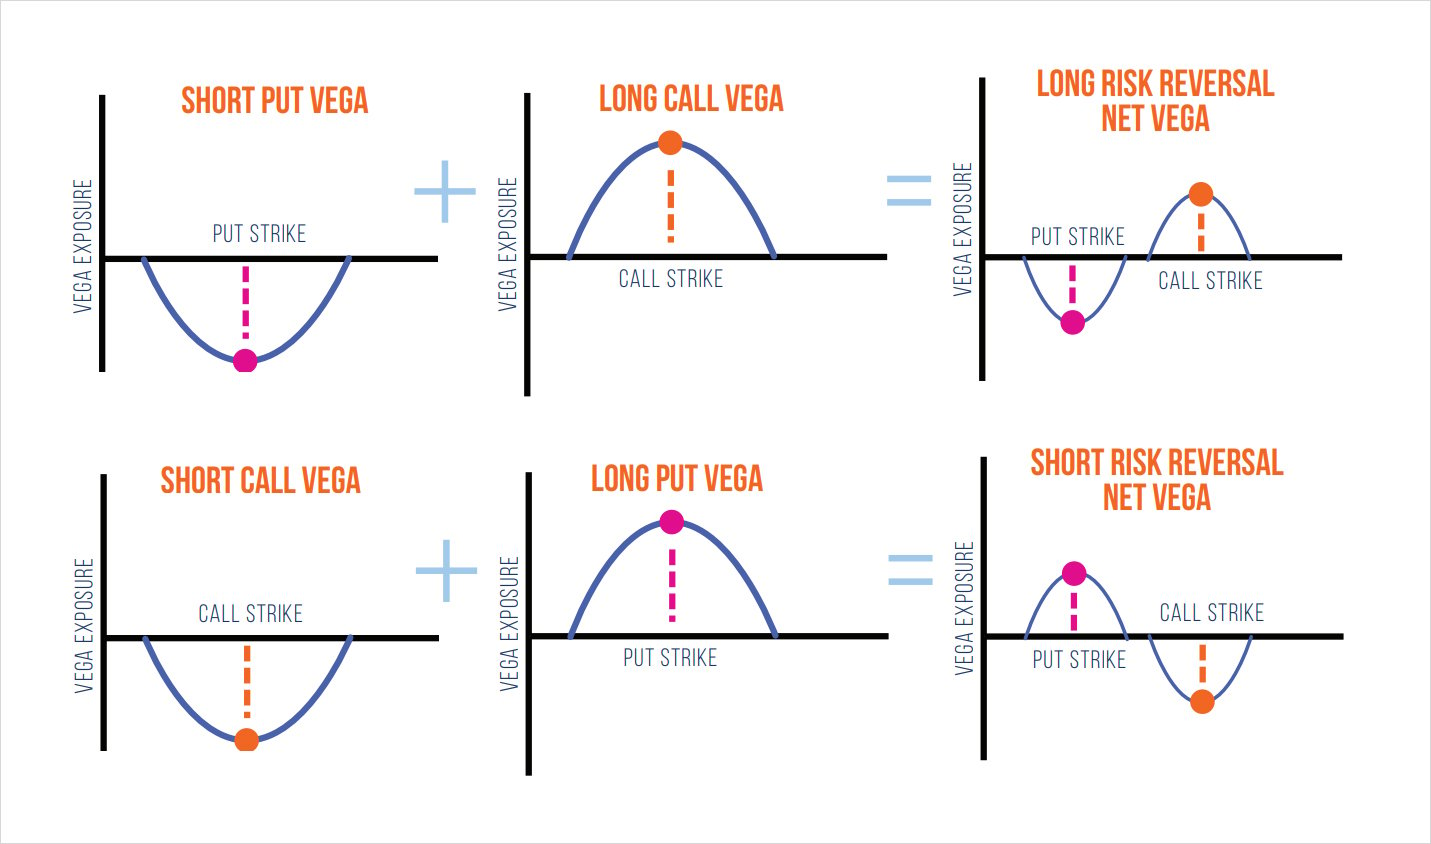
Recall that with the long RR position we are long the call and short the put. Therefore, our vega exposure to the call will reach a maximum positive value at the call strike. Conversely, given we are short the put, the vega will reach its lowest negative value at the put strike. In other words, we can say that being long the RR will benefit from positive spot-vol correlation.
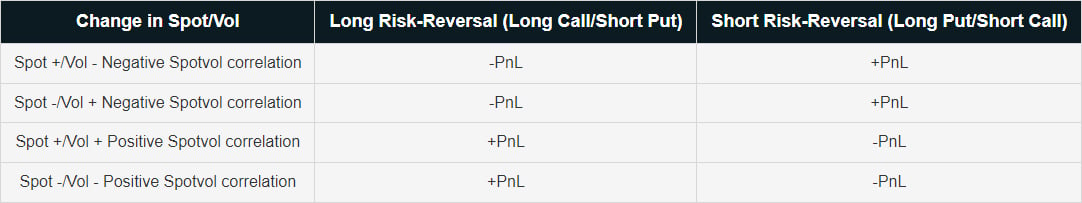
Let’s consider two scenarios which encompass positive spot-vol correlation:
- An increase in BTC price is followed by an increase in volatility: as the price of BTC increases, it will approach the call strike, which will increase the vega exposure of the trade. At the same time, if implied volatility is increasing while vega is high, this will result in more profit compared to if vega was lower (ie: +vega × +vol = +P&L).
- A decrease in BTC price followed by a decrease in volatility: in a long RR position we’re short the put option; therefore, for any downside price action the net vega exposure is negative. Consequently, a decrease in volatility coupled with negative vega would result in profit (ie: -vega × -vol = +P&L).
Conversely, we can also look at this perspective from a short RR position which benefits from negative spot-vol correlation:
- A decrease in BTC price followed by an increase in volatility: in a short RR trade, as the price of BTC falls, the net vega of the long put position will increase. Therefore, it is favorable for volatility to increase as prices fall, given the trade’s positive vega exposure. (ie: +vega × +vol = +P&L).
- An increase in BTC price followed by a decrease in volatility: this would benefit the short call position because as price increases the net vega exposure to the call is reduced. At the same time, if volatility is decreasing then a net negative vega exposure will benefit from this (ie: -vega × -vol = +P&L).
Note: while this framework does not perfectly describe the spot/vol relationship in all scenarios, it can help us identify regimes where trading certain RR structures can be more favorable.
At this point, we can now discuss some of the details of the academic paper used as the foundation for this research note. The aim of “The Risk-Reversal Premium” is to demonstrate how investors can monetize the supply/demand imbalances in traditional option markets by trading RRs. Furthermore, the authors share backtested returns of each strategy and showcase how including RRs in a broader portfolio can improve the overall risk-adjusted return. The authors suggest that the risk-averse nature of investors and constant demand for downside protection causes put options to be overpriced relative to calls. To prove this hypothesis, several backtests were performed to showcase that buying the RR on index ETF options (buy the call and sell the put) outperformed the index with strong risk-adjusted returns. For this reason, the return generated by this strategy is referred to as the risk-reversal premium. Using the original paper as a foundation, we can extend this research to BTC crypto options and investigate whether these findings remain consistent.
Analyze Backtested Returns
Below are some key factors to keep in mind when interpreting the backtest results:
- The Deribit BTC options data used for this backtest ranges from 2019-04 to 2022-12. Given that Deribit BTC options are coin-denominated, all P&L will be denominated in BTC.
- The mark option price will be used to calculate P&L. This is not entirely realistic in practice; however, the objective here is to showcase whether any phenomena or inefficiencies first exist. With this knowledge, the trader can then decide on how to position accordingly.
- The target maturity for all options will be 30 days – this maturity was chosen discretionarily but generally has one of the better liquidity profiles on Deribit.
- The model will enter into the trade at the beginning of the week and select strikes closest to the user’s specified delta target. The model will then close this position after one week and roll into new strikes closer to the target delta threshold.
- Throughout the trade, the risk-reversal will be deltahedged daily based on the end of day net exposure. This is the naive baseline approach, as in practice, traders will use dynamic thresholds to execute their hedges accordingly.
From here, we can begin to analyze the first two approaches:
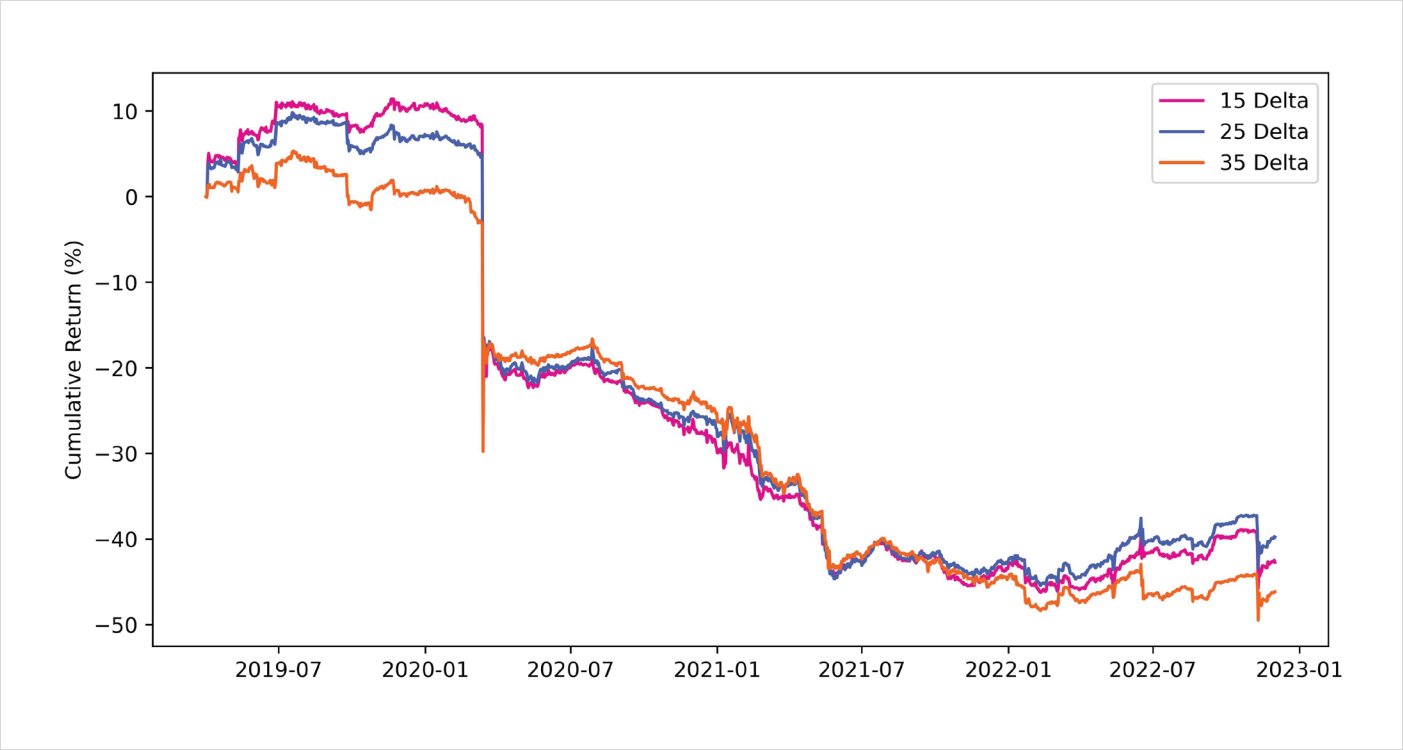
- Long Risk Reversal: systematically sell puts and buy calls
- Short Risk Reversal: systematically buy puts and sell calls
Short puts <> long calls | 30 day maturity | 2019-04-01 to 2022-12-04
Short calls <> long puts | 30 day maturity | 2019-04-01 to 2022-12-01
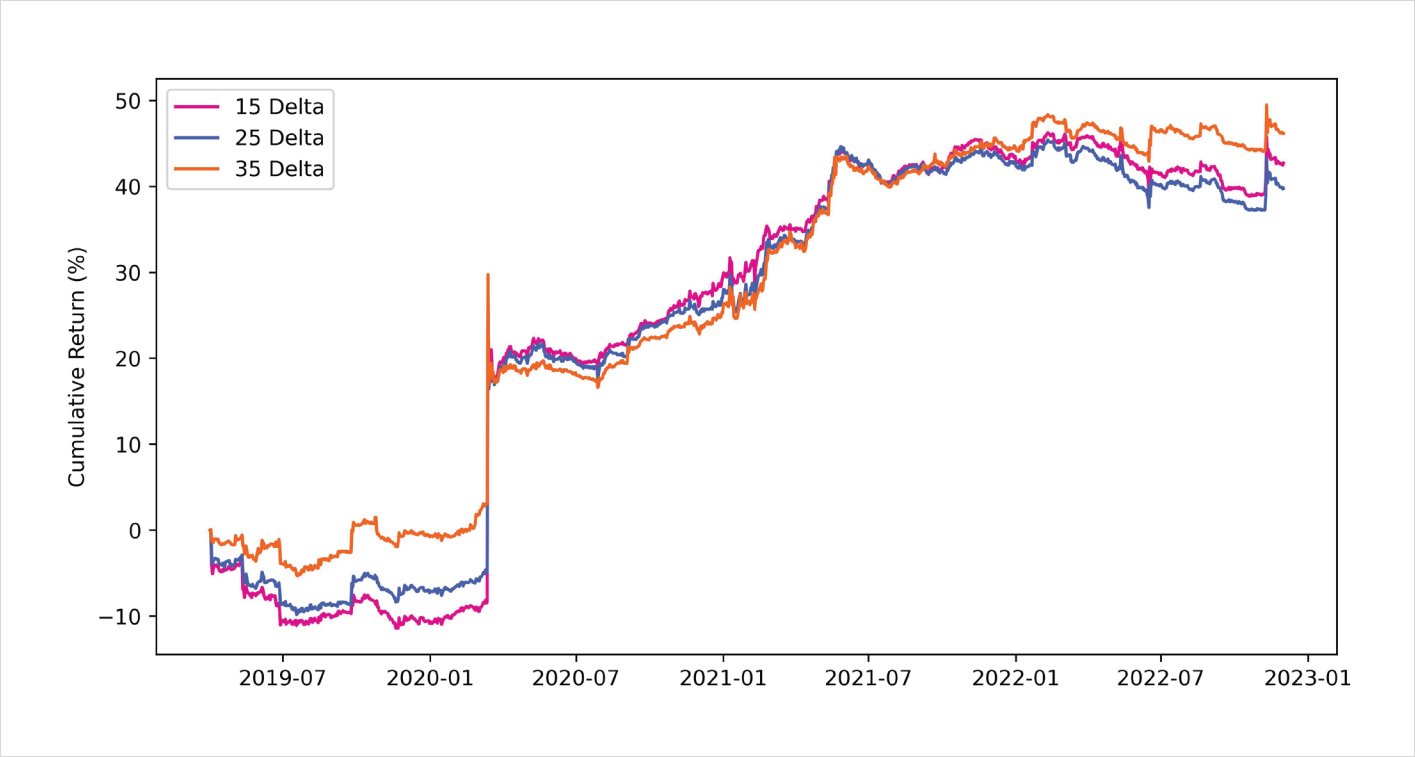
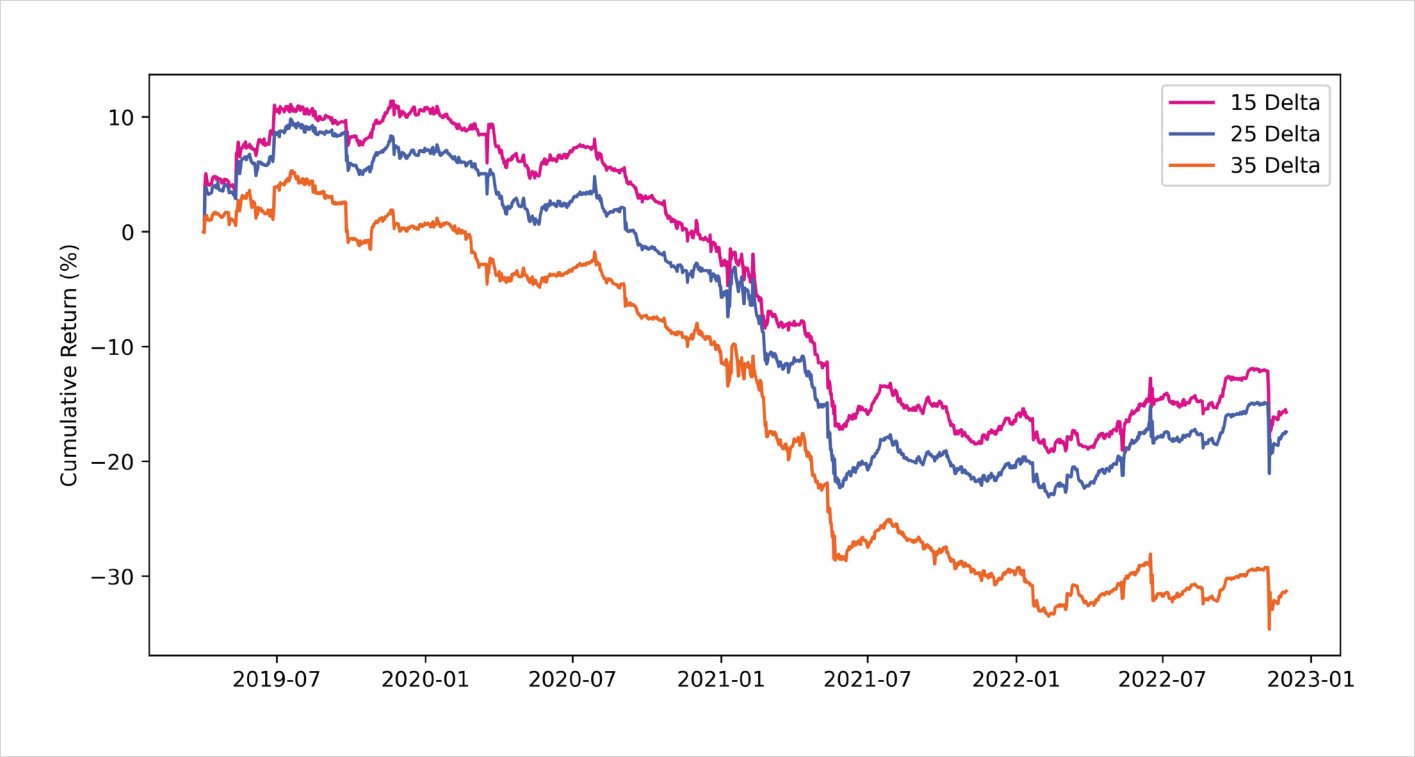
As can be seen, it’s evident that selling the RR is the better of the two approaches. The main driver of P&L stems from the model’s positioning around Black Thursday during March 2020, when the price of BTC nearly halved overnight. Even though the RR trade was hedged, the put option exploded in value and outweighed the P&L from the delta-hedge. Being short the RR would have positioned a trader very well to capitalize from this black-swan event; however, to keep things more fair, we can remove the impact of this single trade and look at the rest of the P&L. It’s interesting to note that despite removing this outlier trade, being short the RR still produces relatively strong returns relative to buying the RR.
Ex-Black Thursday:
Short puts <> long calls | 30 day maturity | 2019-04-01 to 2022-12-01
Short calls <> long puts | 30 day maturity | 2019-04-01 to 2022-12-01
As we discussed earlier above, the performance of the RR will depend heavily on the spot-vol regime of the market. For illustration purposes, below we can see the 60 day rolling correlation between the change in daily BTC closing price and change in 1 month BTC ATM implied volatility over the past 3 years.
Rolling 60 day correlation: BTC close % change <> 1 month
BTC ATM IV % change
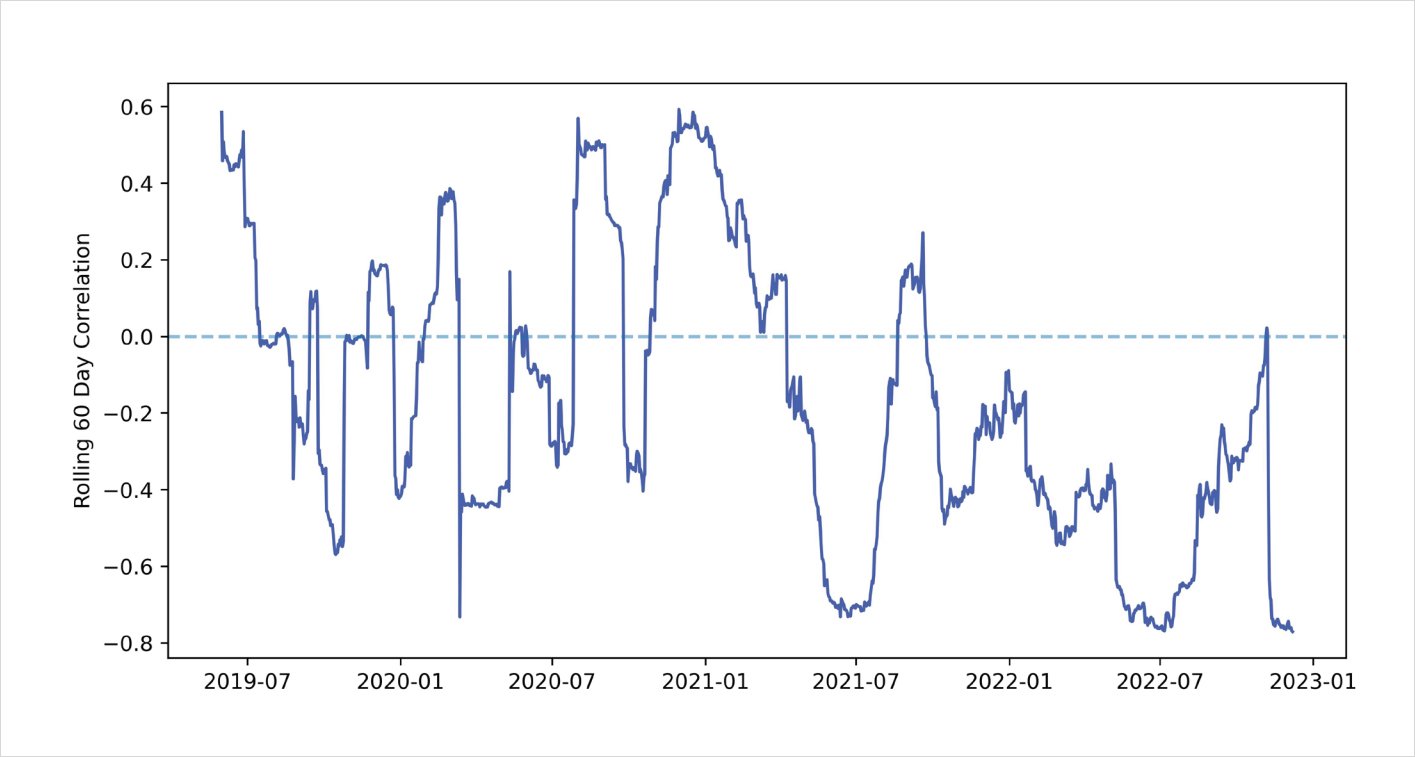
Overall, the correlation between changes in spot and changes in vol is negative 65% of the time, which makes sense when we look at the performance of the short RR trading strategy. Recall that a short RR position performs well during periods of negative spot-vol correlation. Therefore, the backtest results from above align well with these empirical findings.
At this point, we can build upon the previous two backtests and include a timing indicator, which can help filter for higher quality trades. This approach would involve using a market indicator to determine whether to buy or sell the risk-reversal. In this case, our indicator will be the z-score of the 1 month BTC skew time-series.
- The skew data is defined as: 1 month call IV – 1 month put IV (the delta of the skew will depend on the user-specified delta target – ie: for 15 delta we will use 15 delta skew)
- The z-score is calculated as: (current observation – rolling 30 day average) / (rolling 30 day standard deviation)
- Each position will be held-on for a maximum of 30 days, after which any open position will be closed to prevent stale positions
This process above helps normalize the skew timeseries into a format which can be used to identify when skew is out of line, relative to historical data points. When trading a 25 delta RR if the skew is excessively positive this implies 25 delta calls are bid higher than 25 delta puts; therefore, the model would sell the risk-reversal (sell rich calls and buy cheap puts). Conversely, when the skew is negative, then the 25 delta puts have a higher implied volatility than their respective 25 delta calls. Therefore, the model would buy the risk-reversal (sell rich puts and buy cheap calls). Below we can see the backtested returns of running this strategy with a z-score threshold of 1.00.
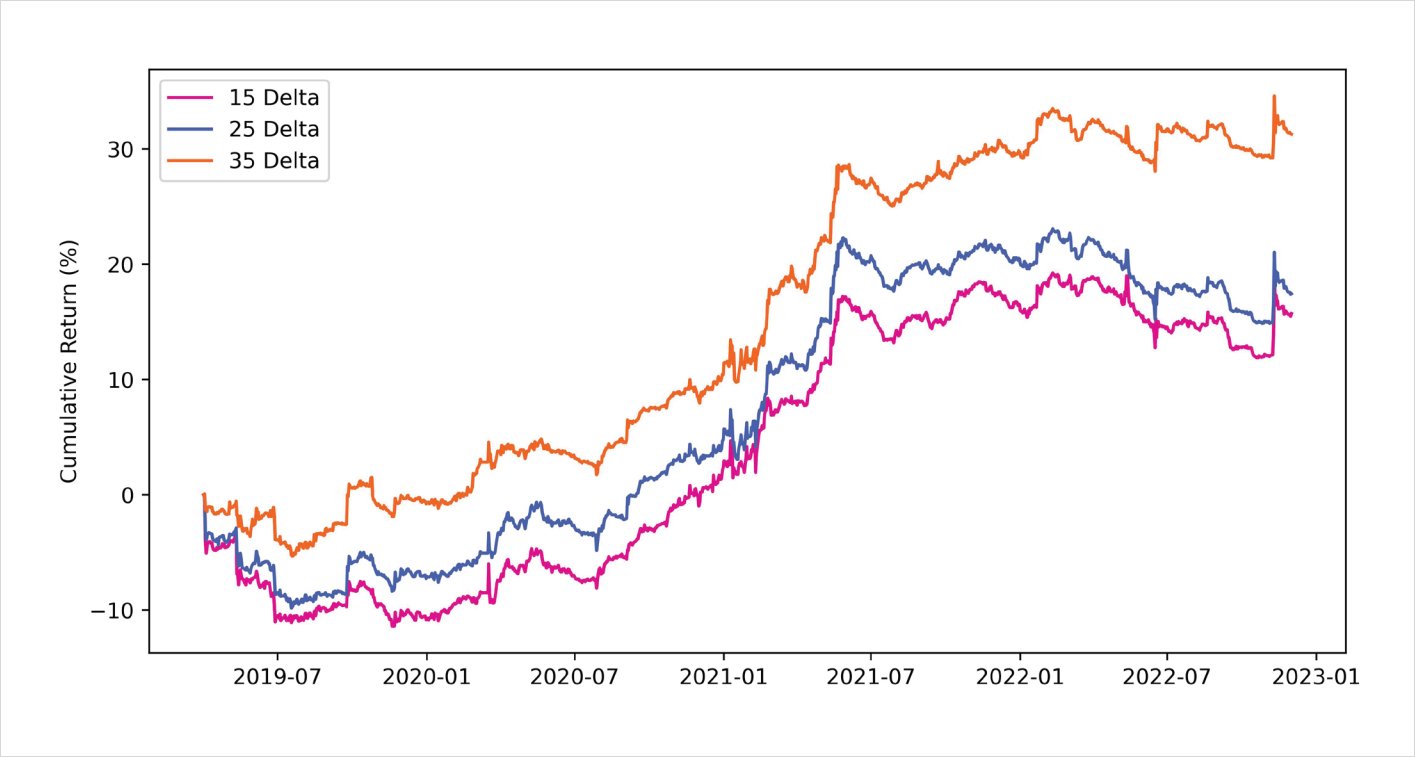
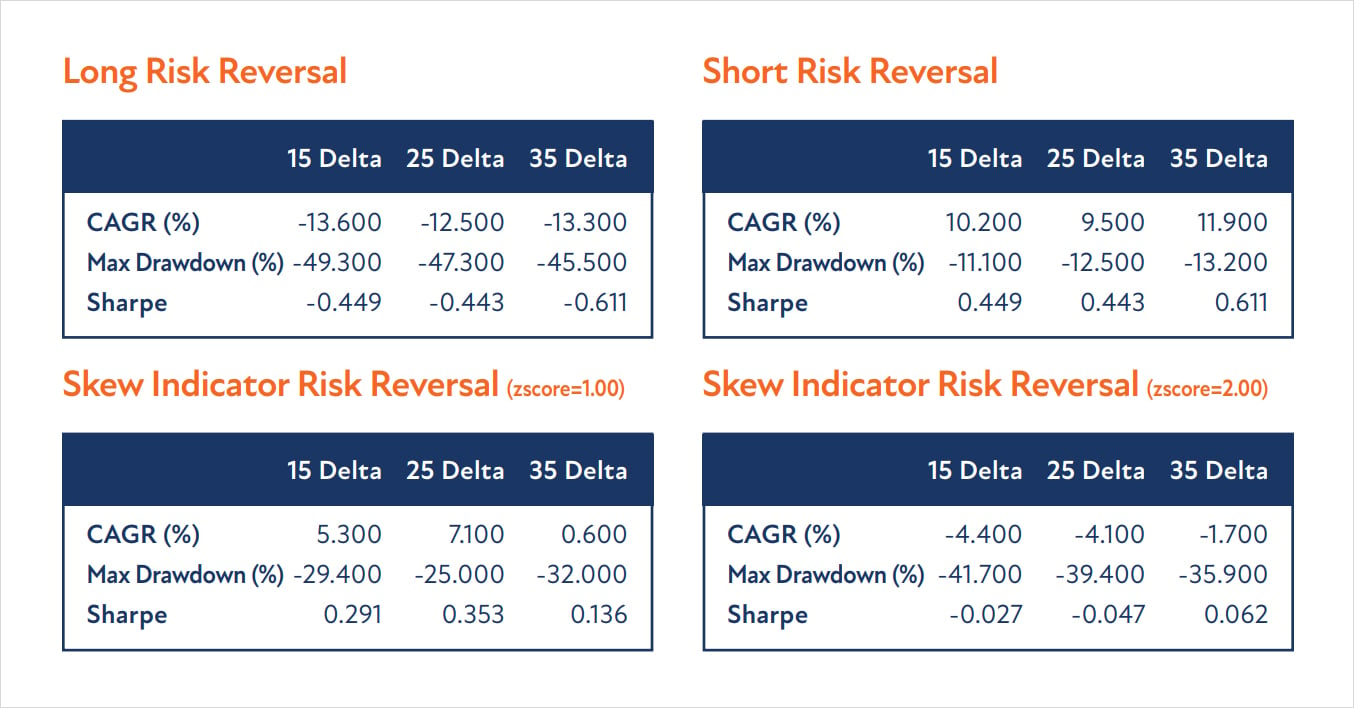
Risk Reversal backtest using skew entry indicator
30 days maturity | z-score = 1.00 | 2019-04-01 to 2022-12-01
Furthermore, on a comparative basis, we can analyze the performance of the metrics across all strategies. Among the different combinations of strategies, simply selling the risk-reversal offers the best risk-adjusted returns. It should be noted that the statistics with simply selling the risk-reversal appear stable across different deltas, which may suggest more robustness compared to the skew indicator model.
One final study that we can perform is analyzing the performance of combining the RR strategy with a long BTC position. Given that selling the RR had consistent returns across all delta thresholds, we will use this strategy for our portfolio analysis.
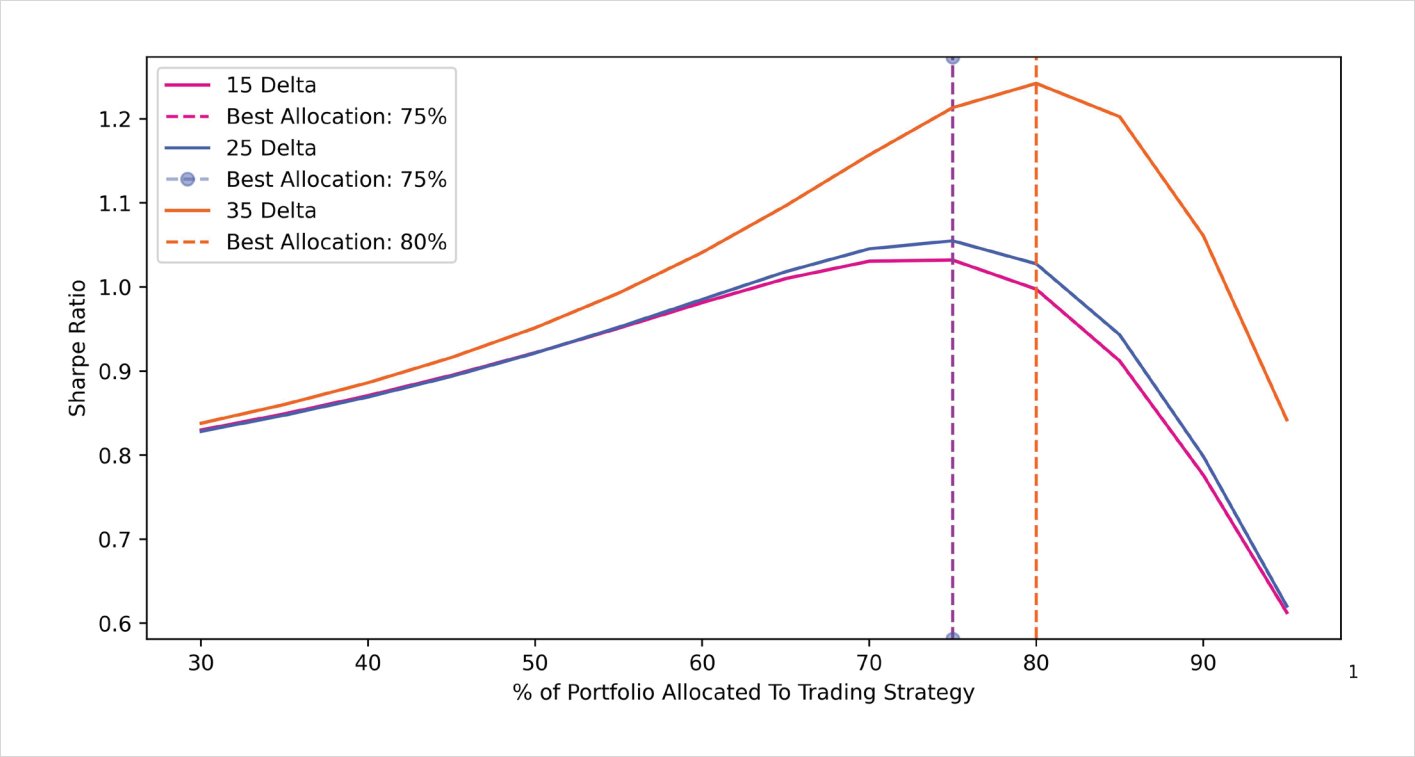
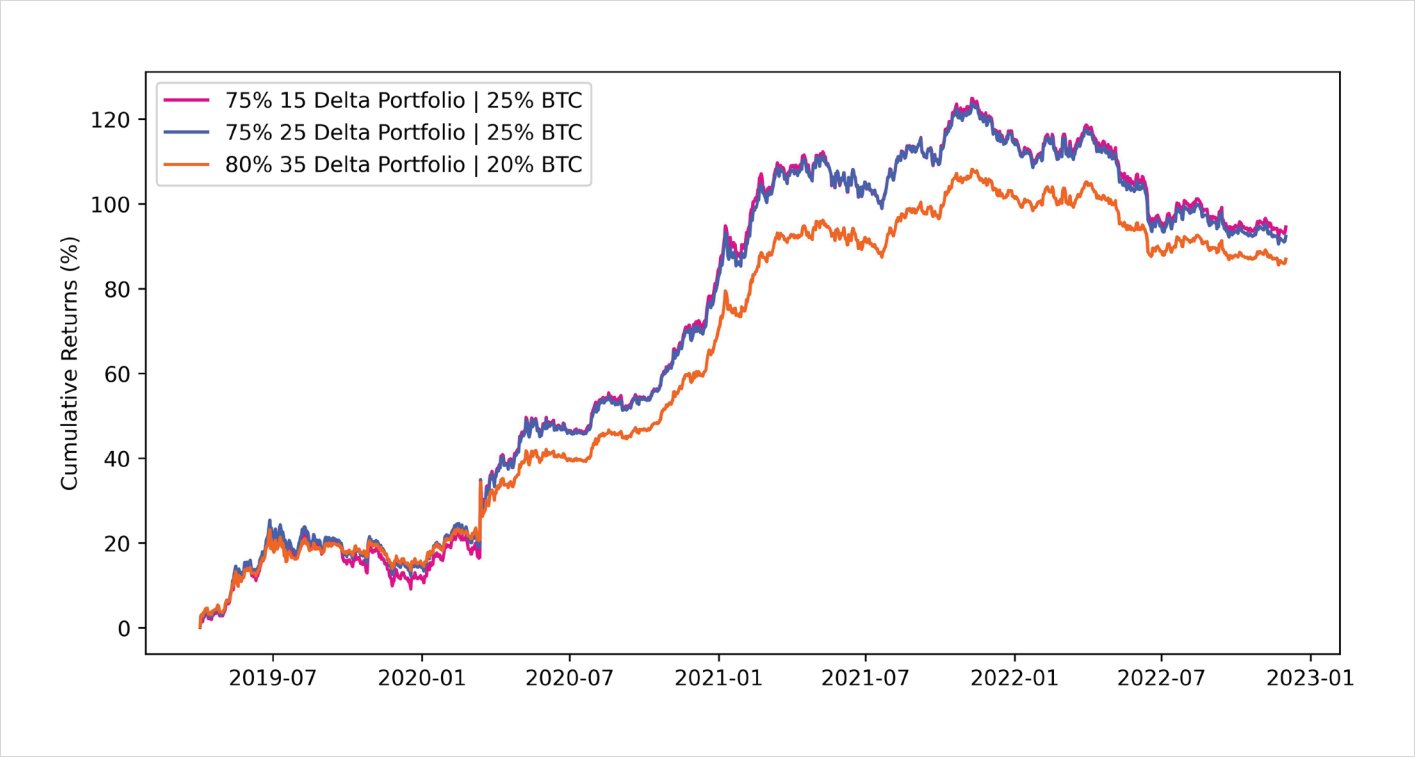
The goal here is to determine the optimal weighting for the trading strategy in the overall portfolio. Below is a diagram outlining the optimal allocation to the RR trading strategy. In the cases below, an allocation anywhere between 75% to 80% dedicated to the trading strategy and the remainder to spot BTC offered the best risk-adjusted returns using the Sharpe ratio.
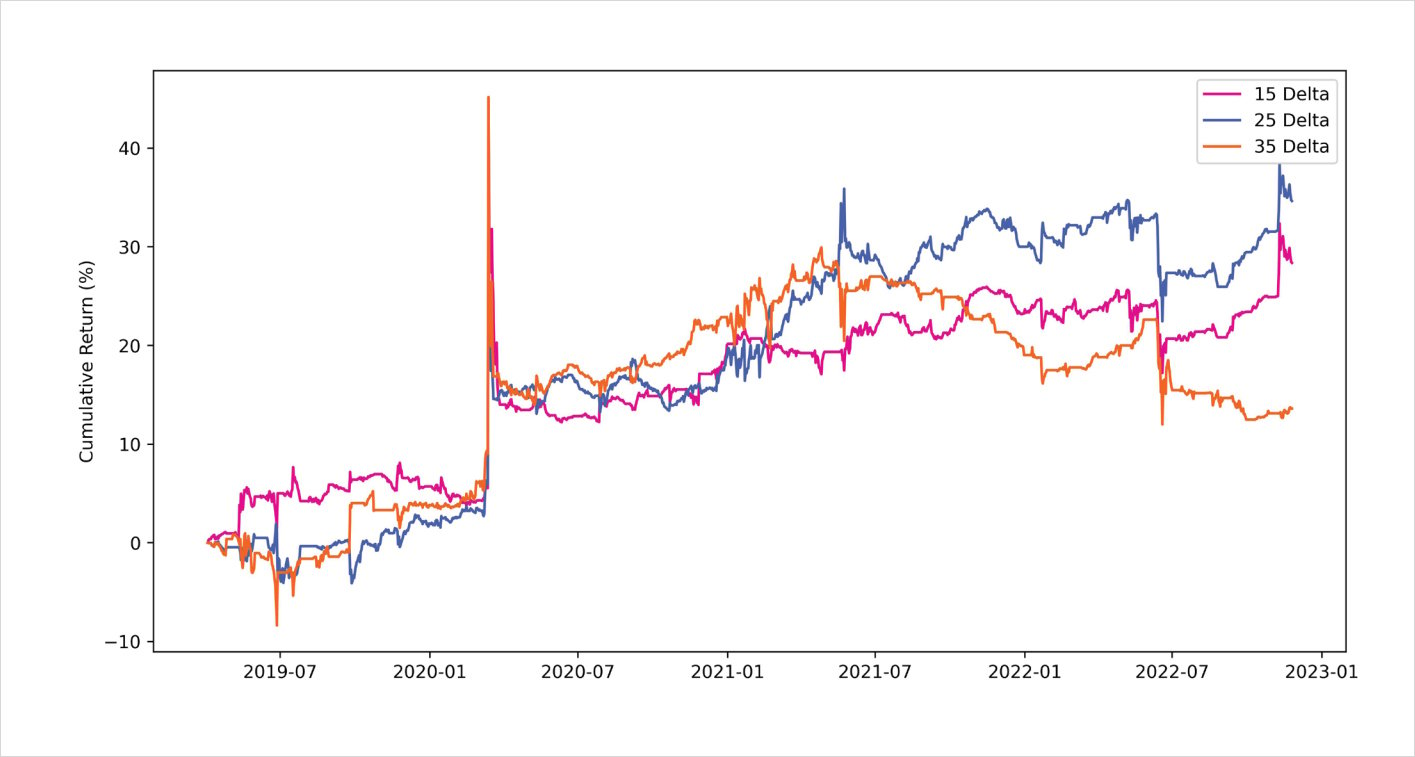
Optimal portfolio allocation: BTC + Short call and long put
Optimal risk-adjusted portfolio cumulative returns: BTC + short call & Long put
Conclusion and Next Steps
Overall, it’s interesting that unlike traditional markets, systematically selling risk-reversals across time offer strong risk-adjusted returns. This can likely be explained by BTC’s strong call skew during the early 2021 bull-market, in addition to several market shocks which greatly rewarded buyers of puts. However, as the crypto options market matures with new institutional participants, it’s reasonable to expect a different regime for trading risk-reversals given the change in supply/demand dynamics. As a result, these strategies will likely become less profitable and new approaches will be required to squeeze out marginal alpha.