The cryptos’ rally in low liquidity fueled a sudden jump in volatility, triggering the first high volatility period of 2023.
The rise in crypto asset prices is related to changes in the macro environment. At the same time, the “gamma squeeze” in the low-liquidity spot and derivatives markets cannot be ignored.
The shift in investor sentiment has supported the current price level, and the FOMC meeting this week will be the key to sustaining the rally.
New Year’s Rally
As the 2023 New Year holiday ends, expectations that the “rate hike cycle is coming to an end” have grown stronger. Economic data suggest that the recession expectations that began to accumulate last year have become “more significant” due to a series of sharp interest rate hikes in 2022. One of the most sensitive indicators of the economic cycle, the difference between 10-year and 2-year T-Notes yields hit a 40-year low record, second only to the Volcker era.
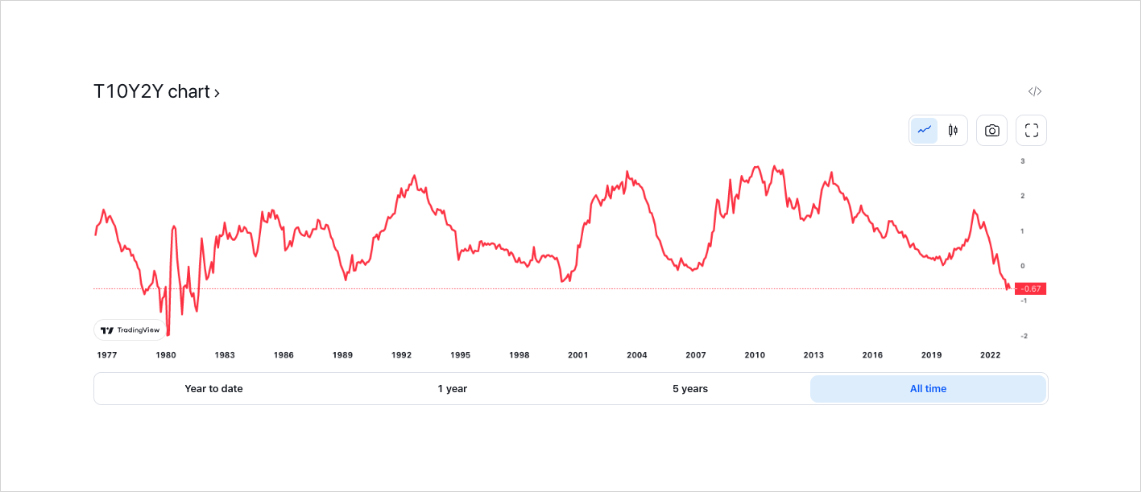
The difference between 10-year and 2-year T-Notes yields, as of Jan 31, 2023. Source: TradingView.com
The growing threat of recession has forced the Fed to consider easing its tightening policy to some extent. After adopting aggressive tightening policies for major capital markets such as the US, the EU, and Canada, their inflation levels have dropped significantly, better than the average of OECD countries. At the same time, the PCE data also fell back to a year ago.

CPI changes in selected major OECD countries, as of 31 Jan 2023. Source: oecd.org

Changes in US CPI, as of Jan 31, 2023. Source: tradingeconomics.com
It is worth noting that although the sharp interest rate hike has caused a significant impact on the economy, the GDP data has not shown a substantial decline in the short term, and the unemployment rate has not yet shown a considerable rise, showing a certain degree of economic resilience. The “inflation or recession” situation envisaged in 2022 has not fully become a reality, and the possibility of a “soft landing” is relatively increased.

Changes in the US unemployment rate from Jan 2022 to date, as of Jan 31, 2023. Source: tradingeconomics.com
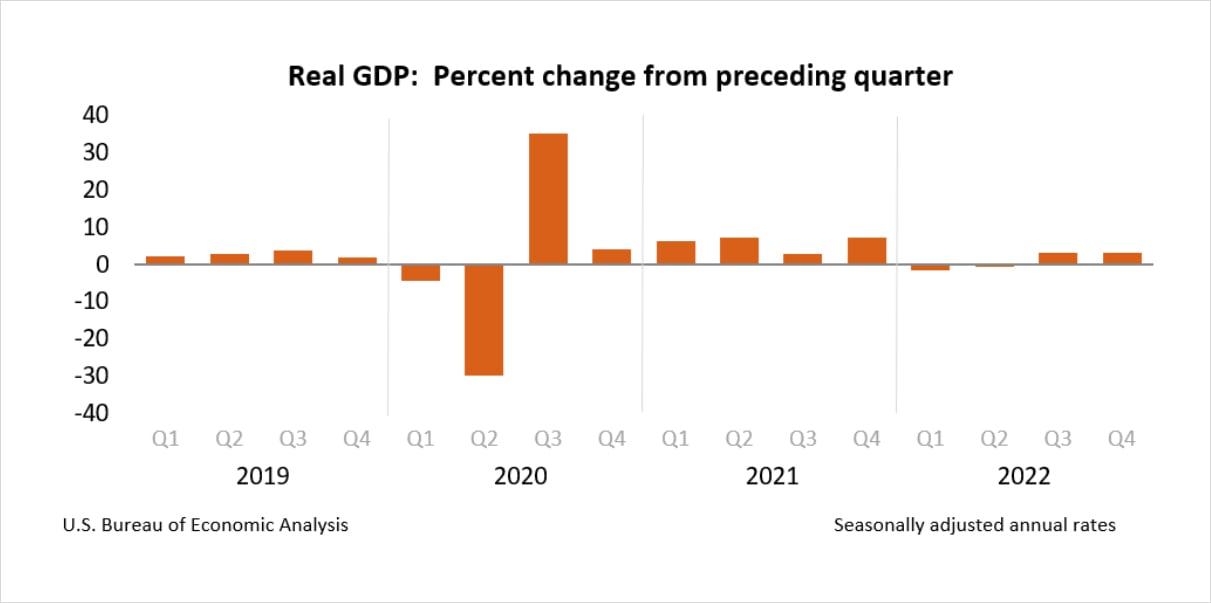
US real GDP changes from 2019 to date, as of Jan 31, 2023. Source: US Bureau of Economic Analysis
In the eyes of investors, slowing the pace of interest rate hikes seems reasonable: it is a better opportunity for central banks, and maintaining previous aggressive tightening policies will only cause a recession. The Bank of Canada’s rate decision in Jan has already shown a similar attitude.
Given the consistency of central bank policies in the US and Canada, it seems that the Federal Reserve will also “should” ease policy pressure. Interest rate traders are confident that the Fed will not risk a recession by raising interest rates sharply and do not expect the endpoint rate to exceed 5%.
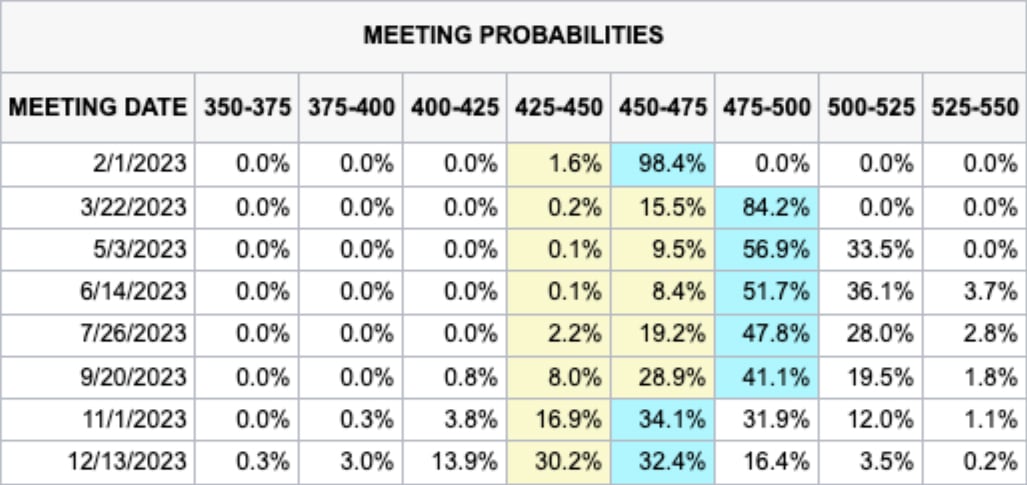
The endpoint rate expectations, as of Jan 31, 2023. Source: CME Group
Optimistic expectations of the Fed easing policy pressure have pushed investors on the sidelines to start returning to markets, leading to a new year rally in 2023. The Nasdaq rallied more than 12% at the start of the new year, and the SP500 index exceeded 4,000. It looks like there is finally a glimmer of light in the prolonged bear market.

The performance of Nasdaq 100, as of Jan 31, 2023. Source: TradingView.com
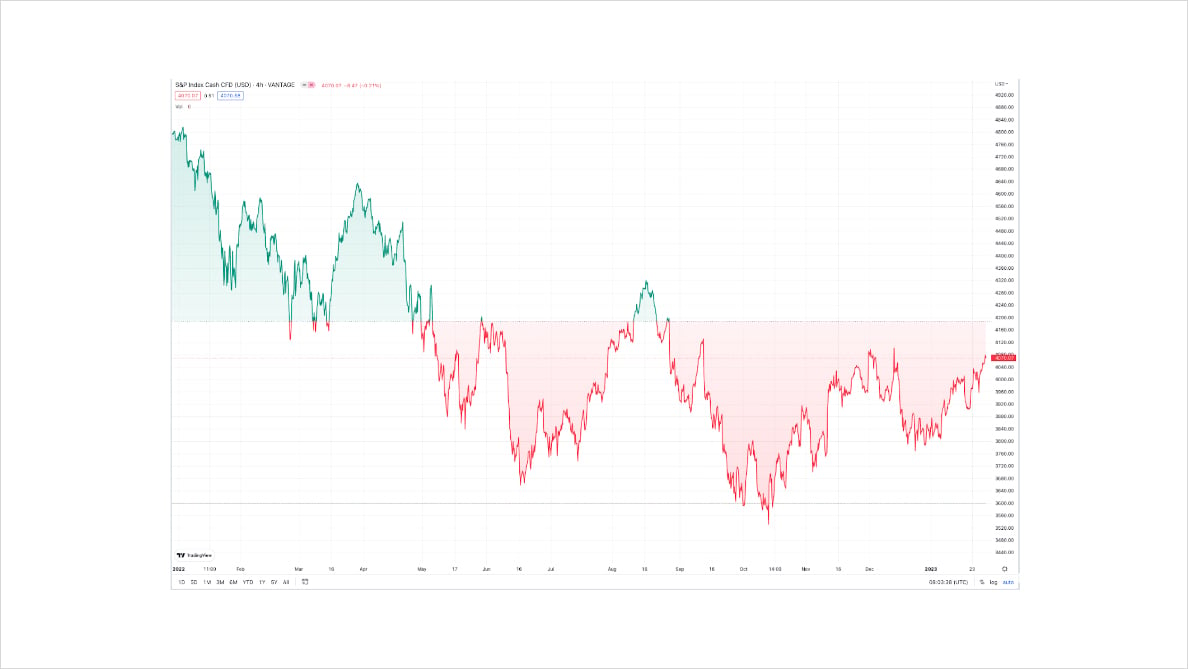
The performance of S&P 500, as of Jan 31, 2023. Source: TradingView.com
However, at the beginning of the US stock rally, the crypto market did not follow. Given the position of the crypto market in the liquidity chain and the series of events that occurred in late 2022, the “long overdue” liquidity seems not unreasonable. While creating a series of trading opportunities, the timing of the arrival of liquidity also provides additional time for crypto whales. The “New Year’s Rally” of the crypto market is ready for launch.
“Volatility Trigger”
Around the New Year’s holiday, liquidity in the crypto market has fallen to its lowest level since 2021, with the monthly volume of spot and Delta 1 contracts in Dec 2022 almost the same as in late 2020. The depletion of liquidity also means opportunity: relatively limited funds are required to significantly push up prices through operations in the spot and derivatives markets. “Gamma Squeeze” became well-known at the GME event in 2021. However, in the crypto market, the gamma squeeze has occurred almost every year since 2021.

Changes in monthly spot trading volume on crypto exchanges. Source: The Block

Changes in monthly Delta 1 contract trading volume on crypto exchanges. Source: The Block
A week before the mid-Jan surge, Block traders had started buying call options of BTC and ETH, putting hedging pressure on market makers. Around Jan 11, Bitcoin prices reached above $17k. At this time, the market makers have had considerable negative gamma exposure:
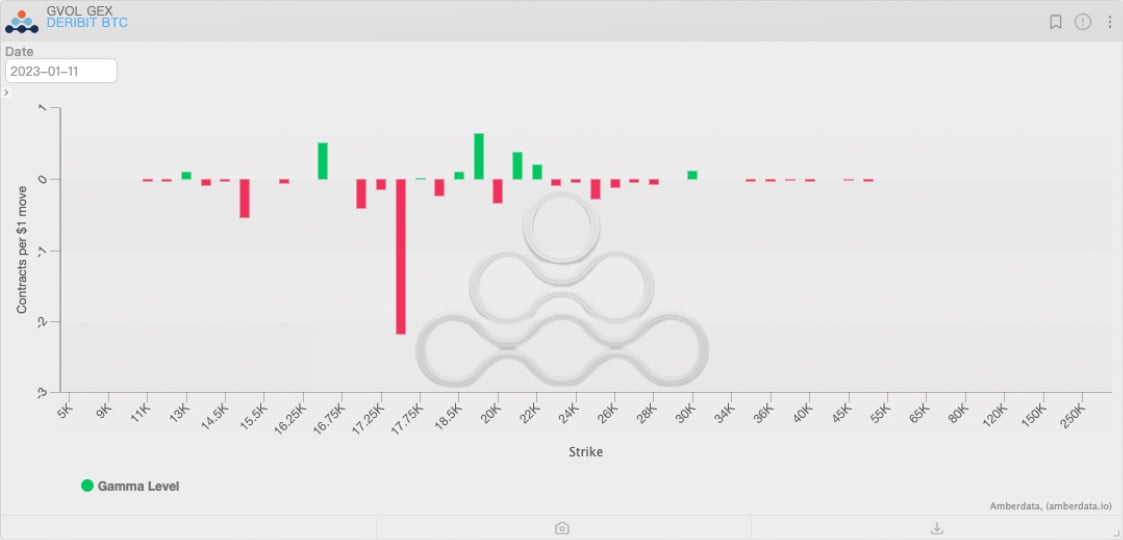
BTC options GEX distribution on Jan 11. Source: Amberdata Derivatives
Gamma is an indicator that measures the acceleration of changes in the price of options relative to the underlying price, which is one of the main risk exposures that options traders, especially market makers, need to pay attention to. Options market makers are usually delta neutral and hedge their risk exposures by buying and selling the underlying spot or futures/perpetual contracts. Under different gamma levels, market makers typically adopt two opposite hedging strategies:
- At the strike prices where gamma exposure is positive, as the price rises, the market makers need to sell more underlying assets to hedge the additional risk. When the price falls, market makers maintain delta neutral by buying underlying assets. Under the influence of the market maker’s “sell high and buy low” behavior, the range of price movements and market volatility decrease.
- However, once the price moves to a position where gamma exposure is negative, the situation becomes completely reversed. As prices rise, market makers must buy assets to hedge additional risk, and when prices fall, market makers sell assets to maintain delta neutral. Given the market maker’s capital size, the behavior of “chasing up and selling down” will significantly push up market volatility.
- “Volatility Trigger” is the node where market makers switch hedging strategies. This concept was proposed by SpotGamma and other US stock options data service providers to define the strike prices of switch hedging strategies.
With the accumulation of negative gamma, market makers had to buy a lot of spots and long Delta 1 contracts – the “Gamma Squeeze” began. Although market volatility has not yet risen, the “Volatility Trigger” has already been pulled, and the buying wave has been triggered.
When discussing the “Volatility Trigger”, another related concept, “Absolute Gamma Strike”, also needs to be considered. Absolute gamma strike refers to the strike price at which the market makers have the highest positive gamma. Around this strike price, many market makers’ hedging positions are linked to it. Moreover, the hedging behavior of the market makers also makes this strike price an important support/resistance level in the market. Once this strike price is broken through, the market will likely experience significant volatility.
On Jan 11, the absolute gamma strike was around $19k. However, on Jan 13, the spot price exceeded the strike price as the bulls continued to buy. Market makers have no choice. Facing the negative gamma, “buy” is the only option:
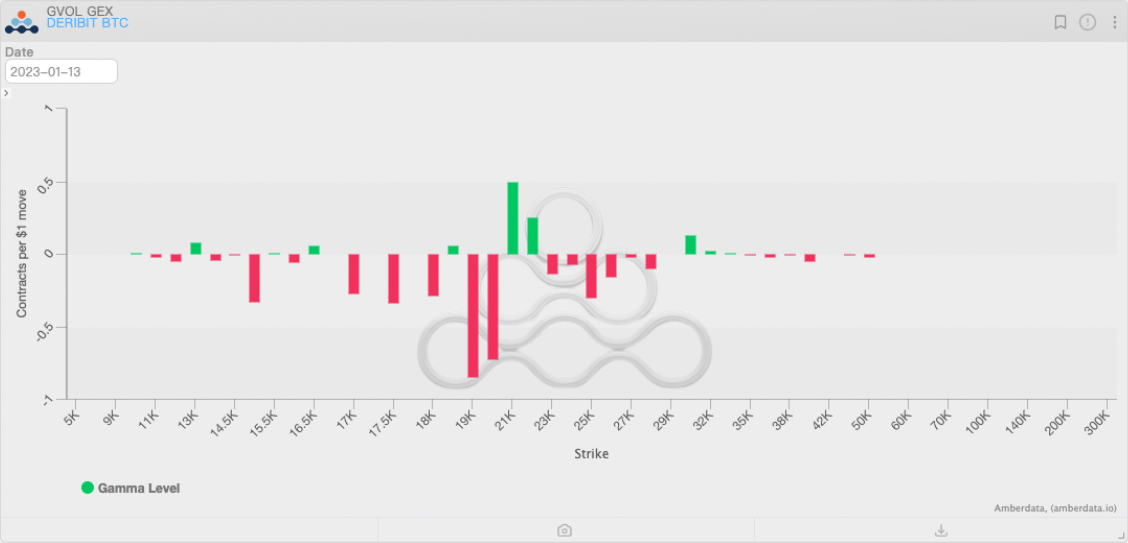
BTC options GEX distribution on Jan 13. Source: Amberdata Derivatives
Whether voluntary or forced, market-wide buying has skyrocketed the prices of mainstream crypto assets. In one day, the price of BTC and ETH rose by more than 10%, and implied volatility also soared. Volatility bulls and price bulls reaped their first pot of gold in 2023, while the scale of shorts liquidation reached a record level in nearly 3 months.
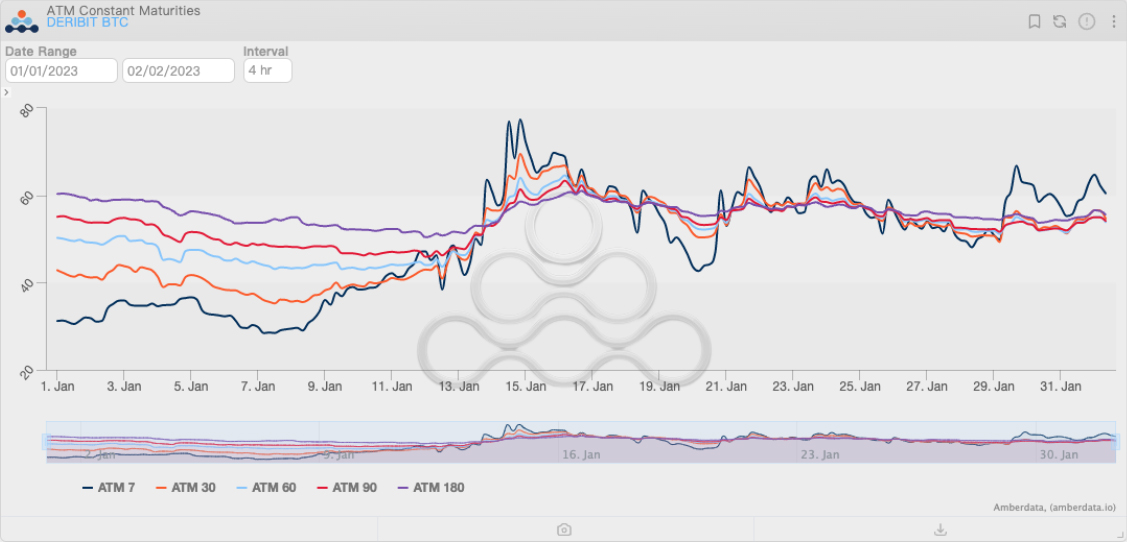
BTC options’ ATM IVs performance in Jan. Source: Amberdata Derivatives
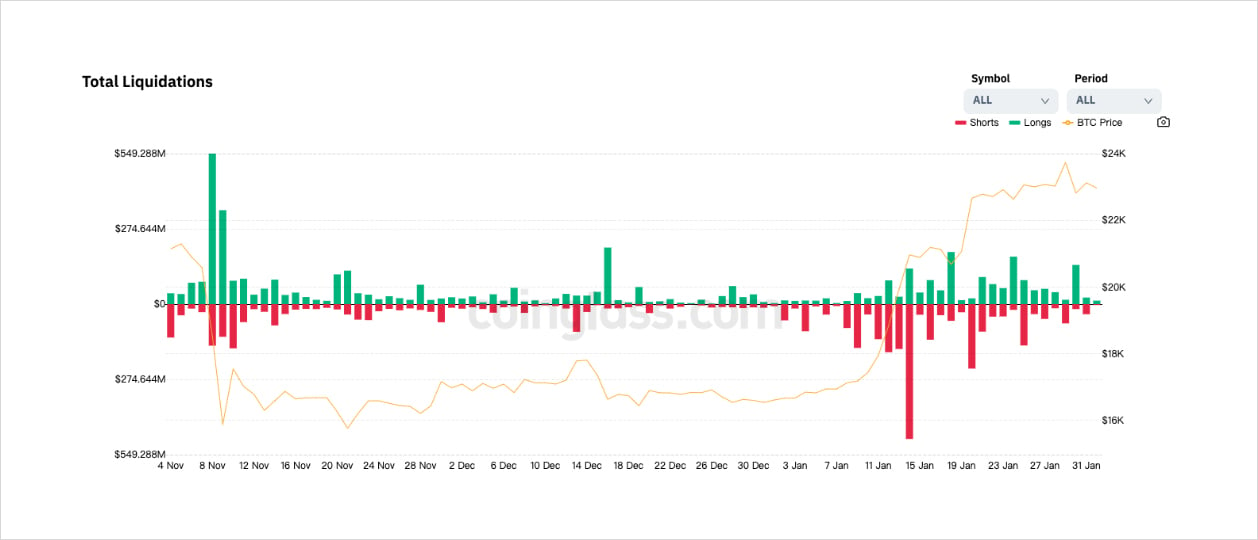
Changes in the liquidation scale of Delta 1 contracts in the crypto market, as of Feb 1, 2023. Source: Coinglass
However, this is not the end of volatility. On Jan 16, market makers faced an even worse situation: more negative gamma at strike prices near the spot price. They had to continue hedging and stimulate further buying in the market. Even in OTC markets, buying left a clear mark, whether for hedging or just buying the dips.
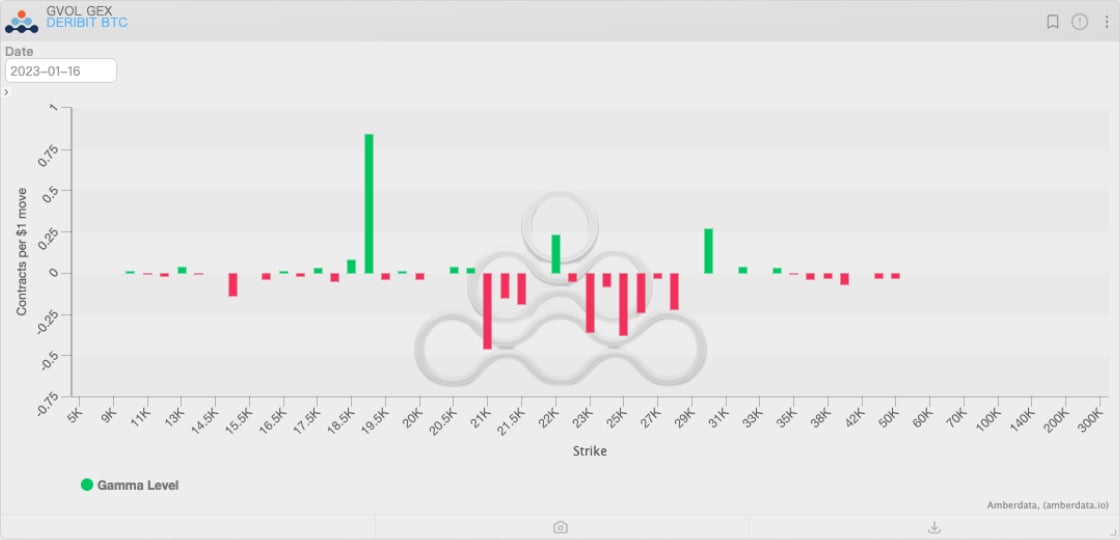
BTC options GEX distribution on Jan 16. Source: Amberdata Derivatives
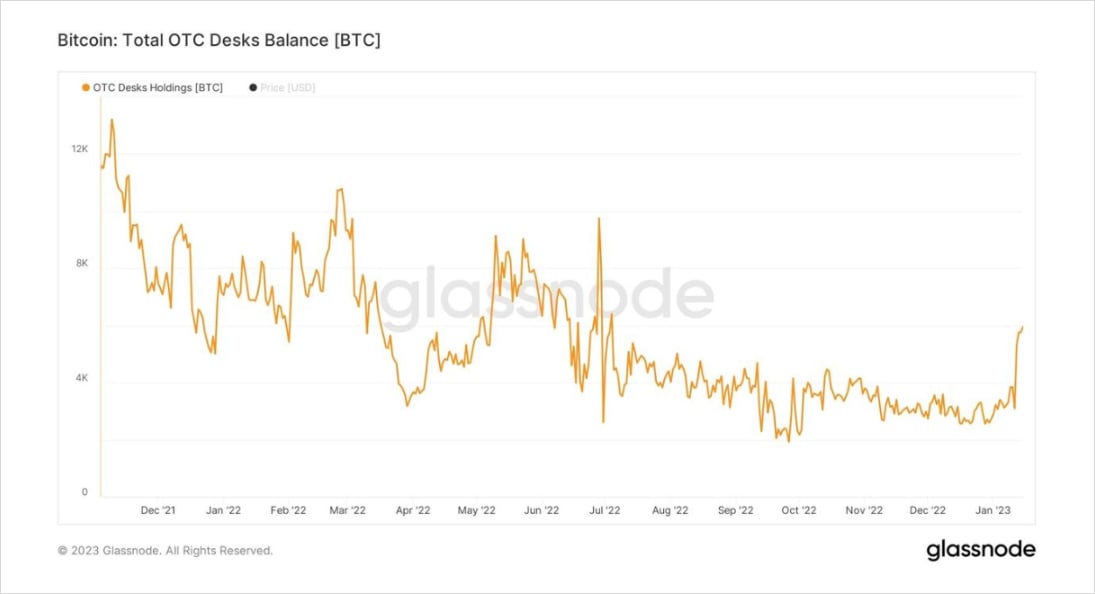
Total OTC desks balance of BTC. Source: Glassnode
Bull Market Trigger?
In the futures market, the BTC far-month futures basis rebounded rapidly, and the gap with the 10-year T-Notes yield narrowed significantly. In the options market, the skewness of BTC options returned to bullish for the first time since 2022, while the skewness of ETH options also returned to neutral.
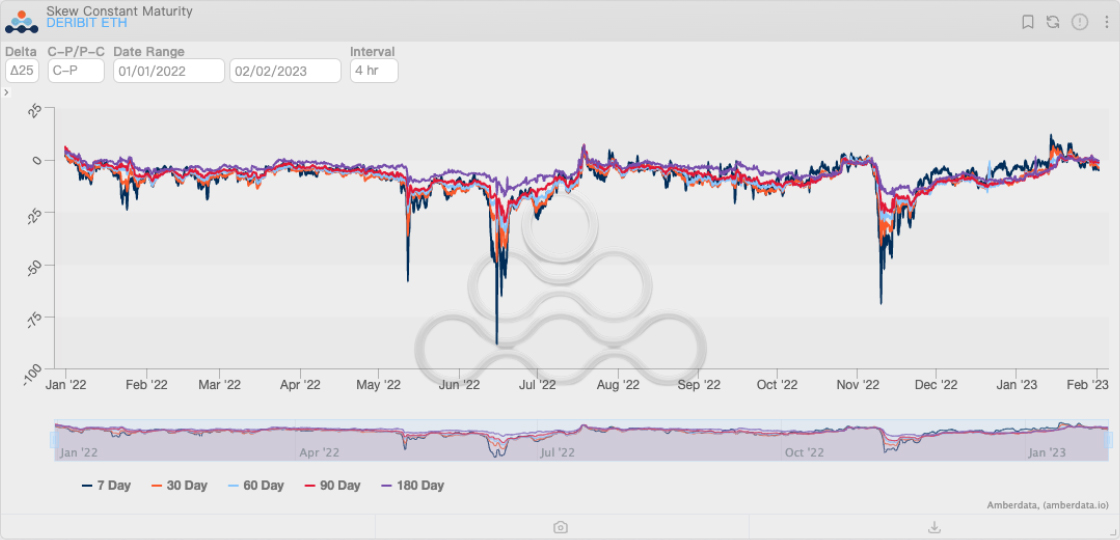
BTC options skewness from Jan 2022 to Feb 2, 2023. Source: Amberdata Derivatives
However, there is not so much momentum for further rallies. From a macro perspective, the end of Fed rate hikes is at least a few months away. Fed officials believe that if there is more evidence of cooling inflation, Fed officials may pause rate hikes in 2023q2. However, the Fed will only consider a pause in rate hikes at its May meeting if the downward trend in inflation continues in 2023q1.
From a micro perspective, investors’ enthusiasm mainly comes from the expectation of the “end of interest rate hikes”, and the core of supporting prices – sufficient liquidity, has not yet returned.
It is not difficult to see that before and after pushing the price up to around $23k, the weekly trading volume of the options fell rapidly, even lower than the volume during the Christmas holiday. Investors’ expectations seem to have been priced to a certain extent: near the $23k strike price of the BTC options, the new absolute gamma strike has been formed, and the price is firmly “stuck”.
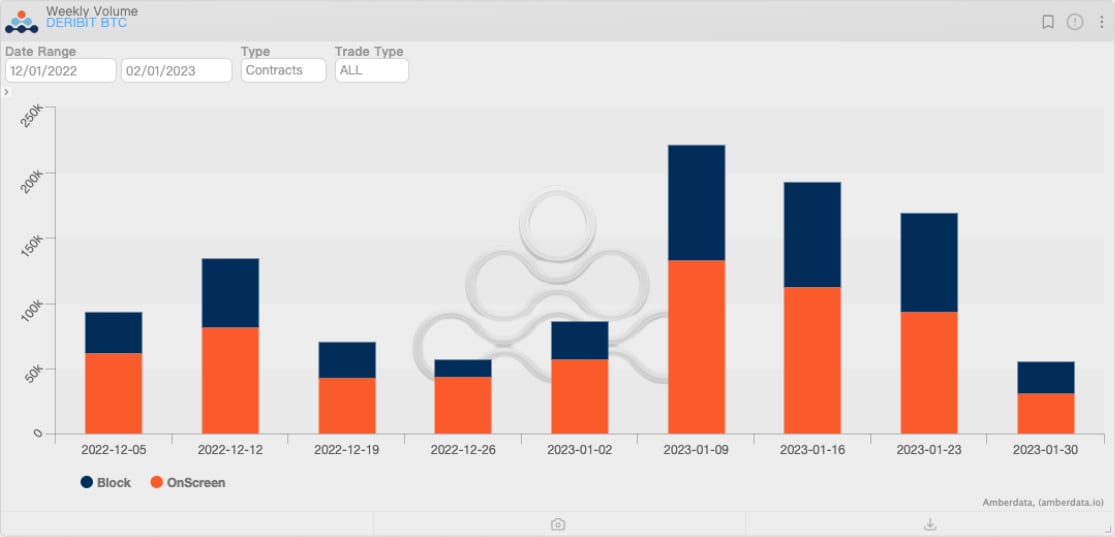
The weekly trading volume of BTC options from Dec 2022 to date, as of Feb 2, 2023. Source: Amberdata Derivatives
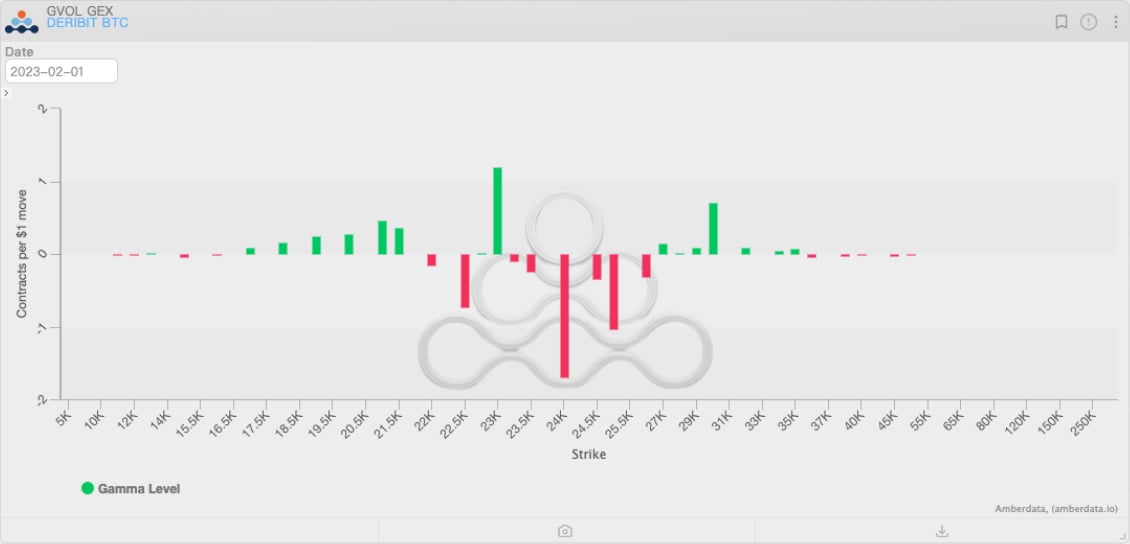
BTC options GEX distribution on Feb 1. Source: Amberdata Derivatives
Although the 25bps rate hike has been fully priced into the market, the Fed’s liquidity policy in 2023 is still unknown. Therefore, the Fed’s statement is crucial.
From the perspective of gamma exposure, if the Fed’s statement is biased towards dovishness under recession threat, the further rebound of crypto prices will not encounter much resistance. In contrast, the hawkish statement may break the current supports and pull the newly formed “Volatility Trigger” near the $23k strike price. Although investors have been praying for a bull market return for a long time, it is still necessary to buy some puts as insurance when buying the dips.