Bitcoin price appears to have entered a historical buy zone after falling almost 70% in the last seven months. Several metrics now suggest that the market bottom is near. Still, BTC could fall to $15,670 before the trend reverses.
Four metrics suggest the Bitcoin price market bottom is near
Fear has hit the crypto market after Bitcoin dropped to $20,800 today. Several technical and on-chain indicators suggest that the leading cryptocurrency may be bottoming out. Bitcoin has reached a critical support area that could lead to a trend reversal.
The pioneering cryptocurrency has seen its price drop by nearly 70% over the past seven months. It has gone from trading at an all-time high of $69,200 in mid-November 2021 to recently hitting a new yearly low of $20,800. Although the macroeconomic environment remains bearish due to uncertainty in the global financial markets, BTC appears to be nearing a market bottom.
The 200-week moving average has acted as the last line of defense in previous bear markets. Since 2015, every time Bitcoin has retraced to this key support level; the price has begun to consolidate, forming a market bottom before a new bull cycle begins. BTC is currently near its 200-week moving average, which could be an early sign that the trend is about to reverse.
Bitcoin’s Entity-Adjusted Dormancy Flow also suggests that the flagship cryptocurrency could be forming a market bottom. It considers the ratio of the current market capitalization to the annualized dormancy value to determine whether experienced market participants are spending their BTC. This on-chain metric has almost perfectly timed every market bottom since 2011. Whenever there is a substantial decrease in spending from long-term holders, or “old hands,” the Entity-Adjusted Dormancy Flow drops below the 250,000 thresholds, representing an excellent historical buy zone.
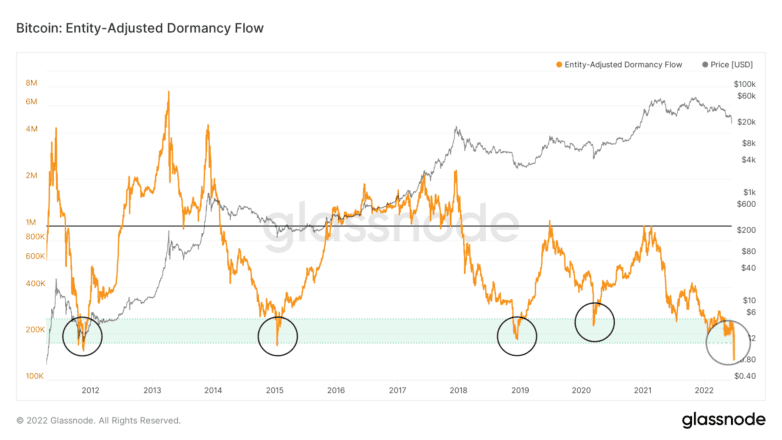
Bitcoin’s Entity-Adjusted Dormancy Flow | Source: Glassnode
The Entity-Adjusted Dormancy Flow currently sits at an all-time low of 149,150 and could signal the end of the current downtrend. The Net Unrealised Profit/Loss (NUPL) indicator is also helpful when anticipating shifts in market sentiment and predicting market tops and bottoms. It relies on multiple on-chain data points to demonstrate potential investors’ emotions at a given time, which helps determine price movements.
The market sentiment around Bitcoin appears to have shifted from “Fear” to “Capitulation” after prices dropped to $20,800. This represents the last stage of a bearish cycle before the market sentiment shifts into “Hope” to signal the beginning of a new bull market.
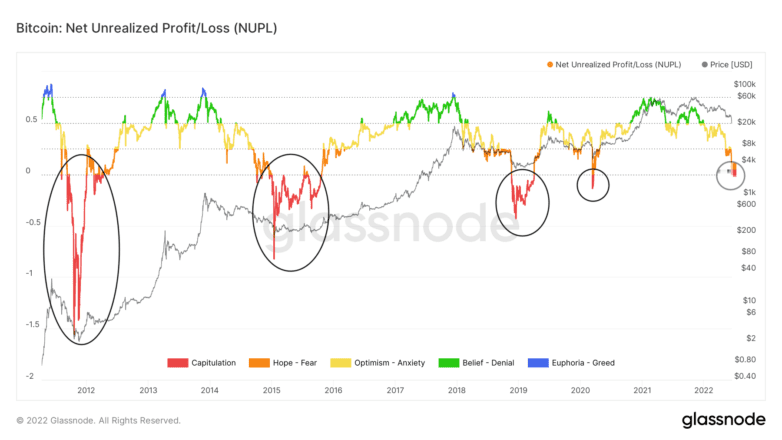
Bitcoin’s Net Unrealized Profit/Loss | Source: Glassnode
While technical and on-chain data show many signs of a market bottom, there could still be room for Bitcoin to fall further before a recovery begins. The logarithmic regression line identifies two key price levels where Bitcoin could bottom. The non-bubble retracement band lies at $23,210, while the non-bubble lower retracement band hovers around $15,670.
Bitcoin is trading between the non-bubble retracement and the lower non-bubble retracement band, a signal that marked the market bottom in previous downtrends. While the price may drop towards a non-bubble lower retracement band as it was in March 2020, this indicator suggests that BTC may present a unique opportunity for investors not to re-enter the market.
It remains to be seen whether Bitcoin is entering a period of consolidation before it enters a new uptrend or if it will see a further correction towards the $15,670 level first. Regardless, the risk-to-reward ratio looks favorable for those looking to seize the moment when the market bottoms out.
Read more:
- Liquidations Keep Piling In As Bitcoin Price Dips Below $21,000 Briefly And ETH – Below $1.1K
- Down For The Eighth Consecutive Day, Bitcoin Price Regained 5% After Falling To A 30-Month Low Of $20,834