Bitcoin price could hit $30,000 if the current daily trend of higher highs and lows continues
The Bitcoin price rose above $23,000 again as a new analysis predicted a potential surge of 20% or more. At the time of writing, BTC is changing hands at $23,005.

BTC/USD 4-hour chart | Source: TradingView
The daily chart gives trader $30,000 target in Bitcoin price
BTC/USD climbed overnight to once again sit near the top of its established trading range. After multiple attempts to break out above range resistance at $23,500, the pair appeared to still be stuck in limbo at the time of writing, but hopes of bullish continuation were already there.
“Expecting more volatility over the wknd,” on-chain monitoring resource Material Indicators wrote in part of its latest Twitter update on Aug. 5. “If the Bear Market Rally can push BTC above 25k there isn’t much friction to 26k – 28k range. Losing the trend line would be bad for bullish hopes and dreams.”
$28,000 would be over 20% higher than the current spot price and would represent a nearly two-month high. Material Indicators included a chart showing the trendline mentioned sitting at $22,000 — around Bitcoin’s current realized price.
The chart further showed bid support increasing immediately below the spot, while major resistance lay at $24,500.

BTC/USD buy and sell levels (Binance) with a trendline | Source: Material Indicators/ Twitter
Weekend trading traditionally sparks more volatile price action thanks to a lack of liquidity on exchange order books, which are dominated by retail traders while institutions and professionals stay away until the new trading week.
Meanwhile, analyzing the daily chart, popular trading account CROW entertained even higher levels, revealing plans to take profits only at $30,000 as long as Bitcoin continued making higher highs and higher lows.
“Weekend is all about range trading due to the fake-outs,” pseudonymous trader Crypto Tony added. “I like to identify the range and then play accordingly Ranges are effective at identifying true breakouts, or fake outs. You can play both of them.”
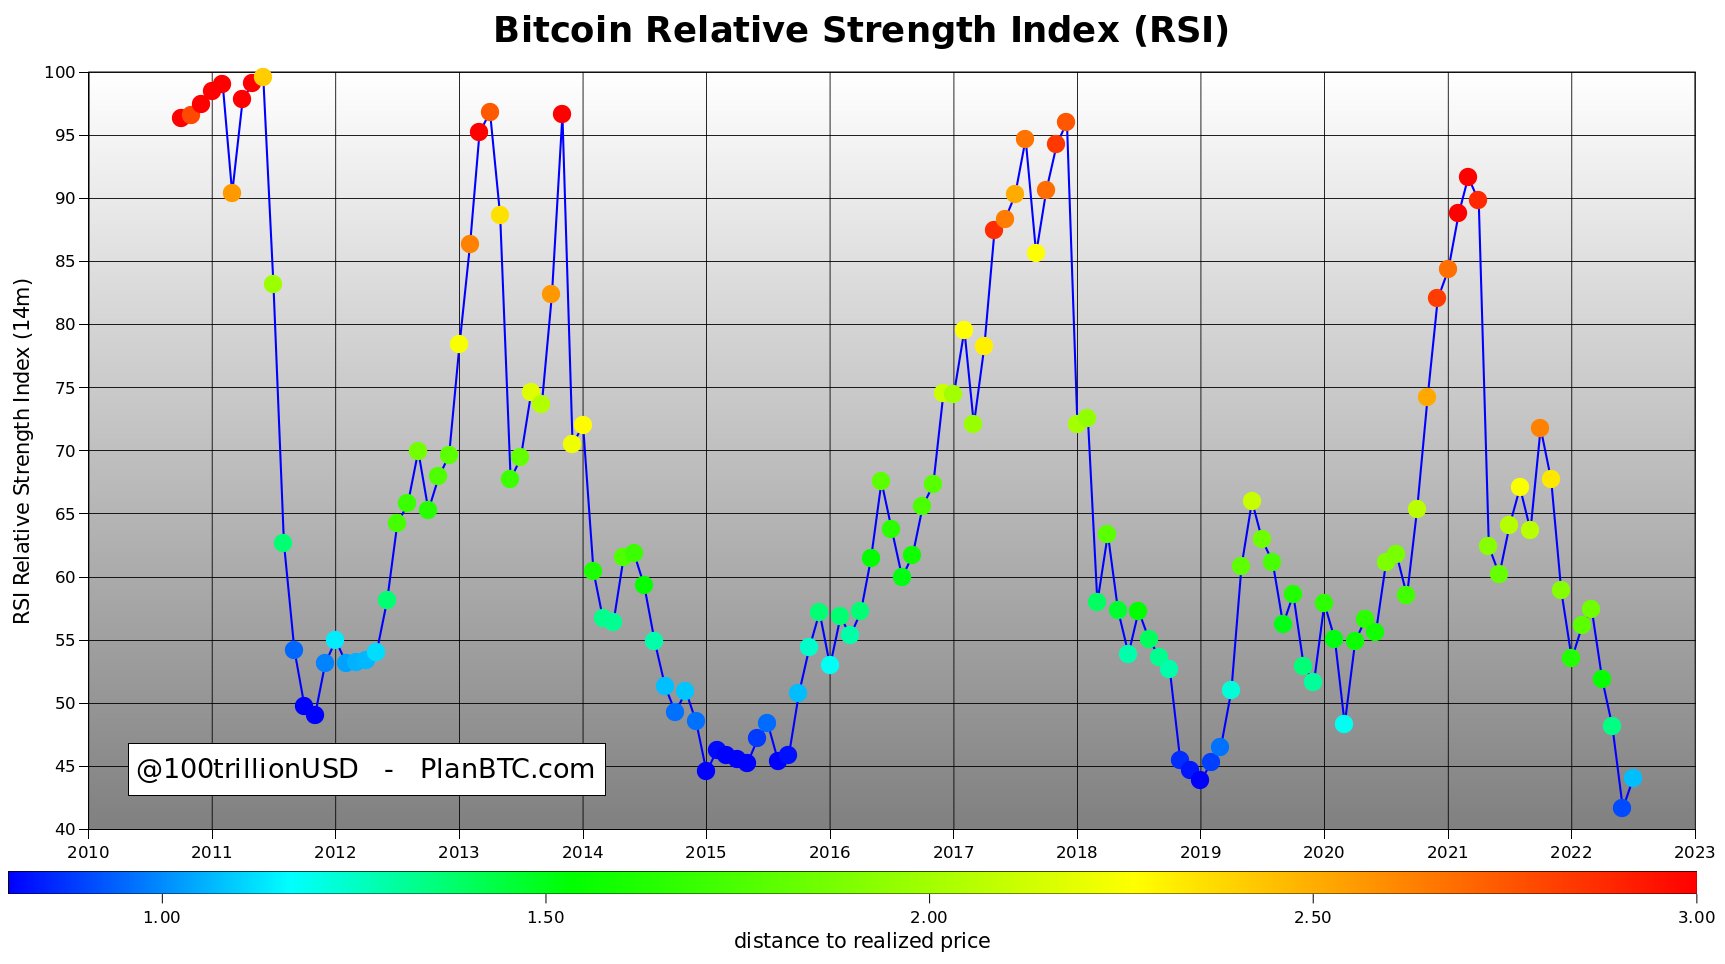
Turning to on-chain data, PlanB, the pseudonymous creator of the stock-to-flow family of Bitcoin price models, again flagged relative strength index (RSI) performance flipping bullish.
RSI is a core metric that shows how comparatively overbought or oversold BTC is at a certain price, and in June it hit its lowest level ever. Now rebounding, RSI could even signal an end to the 2022 bear market, PlanB suggested.
“Relative Strength Index (RSI) bounced back in June. Bear market over?”, PlanB tweeted.
In a previous post on Aug. 3, PlanB acknowledged that BTC/USD was still “far below” the stock-to-flow daily estimate, this being $83,475 for Aug. 6 according to the automated calculator S2F Multiple.
Read more:
- Bitcoin Price Was On Track To Close Out The Week Down 2%
- 8-Year-Old Bitcoin Address Awakens, Moves Massive Amount Of Coins To Weird Addresses